
|
|
|---|---|
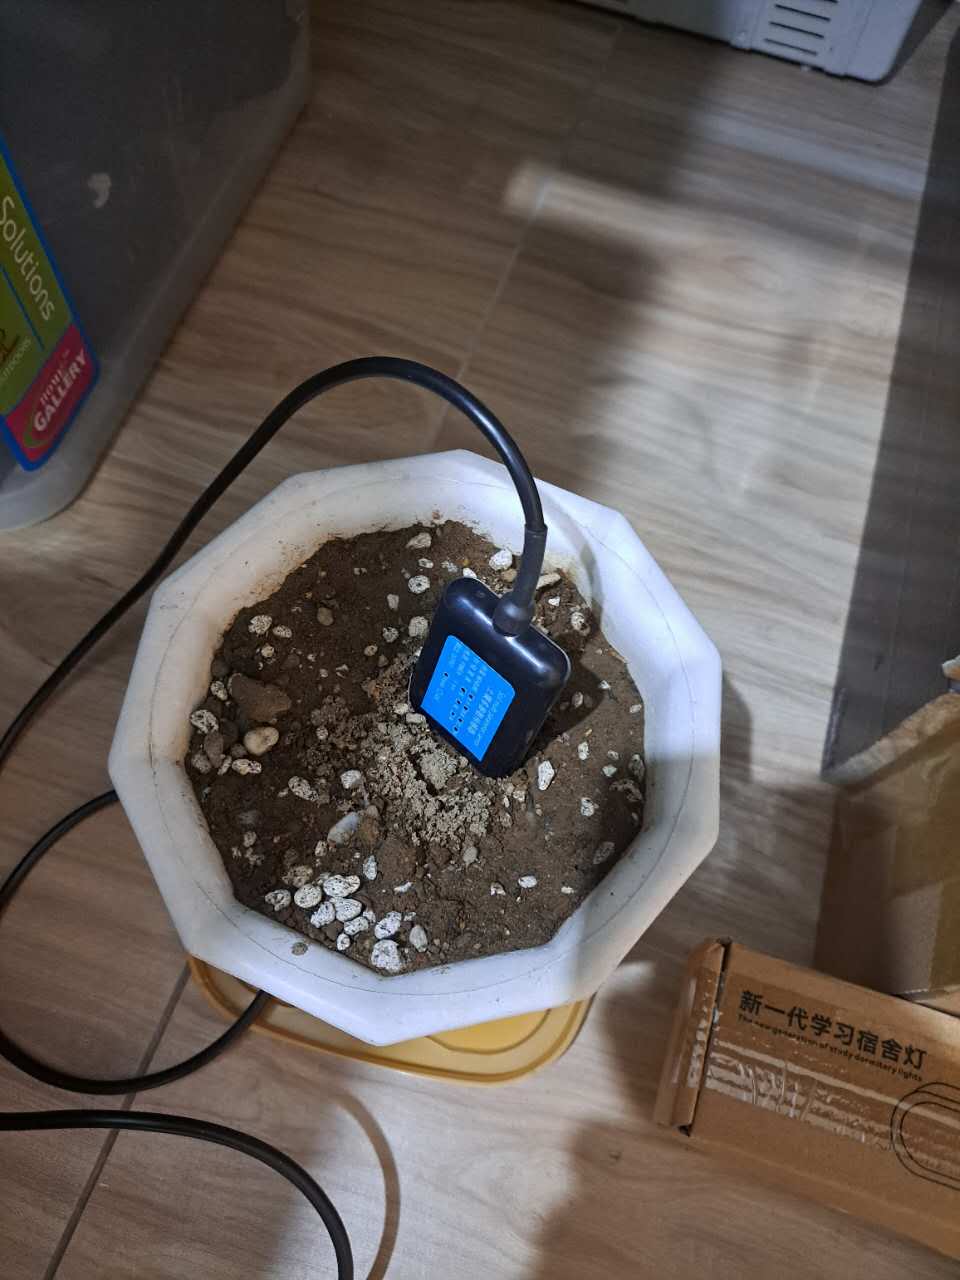
Example for a RS485 soil sensor using RAKwireless RUI3 on a RAK3172.
Tested with the "No-Name" VEM SEE SN-3002-TR-ECTHNPKKPH-N01 sensor.
Code is prepared for the GEMHO 7in1
Soil Sensor with RS485, but not tested.
Sensor works by default with 4800 Baud
VEM SEE SN-3002-TR-ECTHNPKKPH-N01 Soil Sensor register setup
| Address | Multiplier | Register content |
|---|---|---|
| 0x0000 | /10 | Moisture |
| 0x0001 | /10 | Temperature |
| 0x0002 | *1 | Conductivity |
| 0x0003 | /10 | pH |
| 0x0004 | *1 | Nitrogen content (temporary) |
| 0x0005 | *1 | Phosphorus content (temporary) |
| 0x0006 | *1 | Potassium content (temporary) |
| 0x0007 | *1 | Salinity |
| 0x0008 | *1 | TDS (for reference ?????) |
| 0x0022 | *1 | Temperature coefficient of conductivity |
| 0x0023 | *1 | TDS coefficient |
| 0x0050 | *1 | Temperature calibration value |
| 0x0051 | *1 | Mositure content calibration value |
| 0x0052 | *1 | Conductivity calibration value |
| 0x0053 | *1 | pH calibration value |
| 0x04e8 | *1 | Nitrogen content coefficient MSB (temporary) |
| 0x04e9 | *1 | Nitrogen content coefficient LSB (temporary) |
| 0x04ea | *1 | Nitrogen deviation (temporary) |
| 0x04f2 | *1 | Phosphorus coefficient MSB (temporary) |
| 0x04f3 | *1 | Phosphorus coefficient LSB (temporary) |
| 0x04f4 | *1 | Phosphorus deviation (temporary) |
| 0x04fc | *1 | Potassium content coefficient MSB (temporary) |
| 0x04fd | *1 | Potassium content coefficient LSB (temporary) |
| 0x04fe | *1 | Potassium deviation (temporary) |
| 0x07d0 | *1 | Device address |
| 0x07d1 | *1 | Baud Rate |
Sensor works by default with 9600 Baud
GEMHO 7in1 Soil Sensor with RS485 register setup
| Address | Multiplier | Register content |
|---|---|---|
| 0x0006 | /100 | Temperature |
| 0x0007 | /100 | Moisture |
| 0x0008 | *1 | Conductivity |
| 0x0009 | /100 | pH |
| 0x000F | *1 | Device address |
| 0x001E | *1 | Nitrogen content (temporary) |
| 0x001F | *1 | Phosphorus content (temporary) |
| 0x0020 | *1 | Potassium content (temporary) |
Assembly is done with the "standard" mounting plate of the Unify Enclosure.
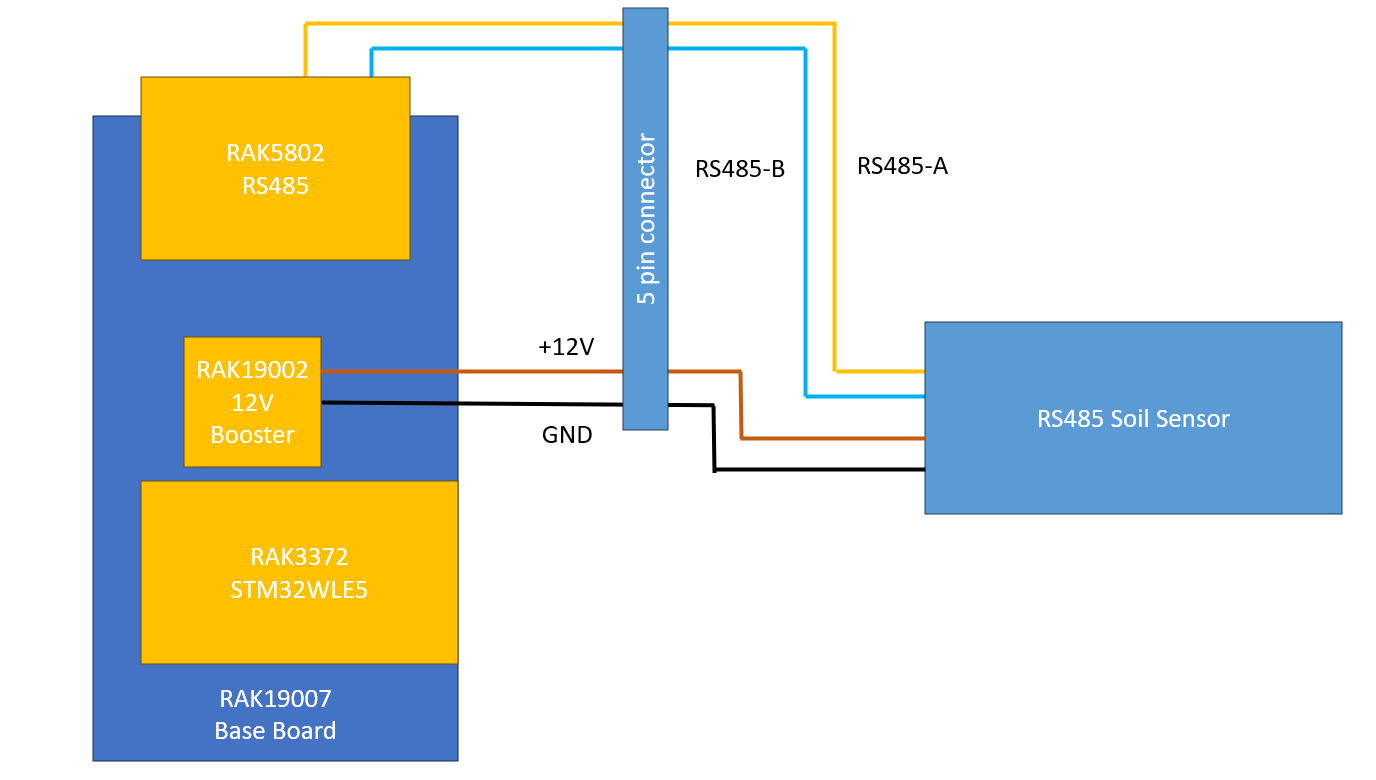
Sensor connection is done
with the 5-pin IP65 connector of the Unify Enclosure with Solar Panel
Antenna used is Blade Antenna with 2.3
dBi gain.
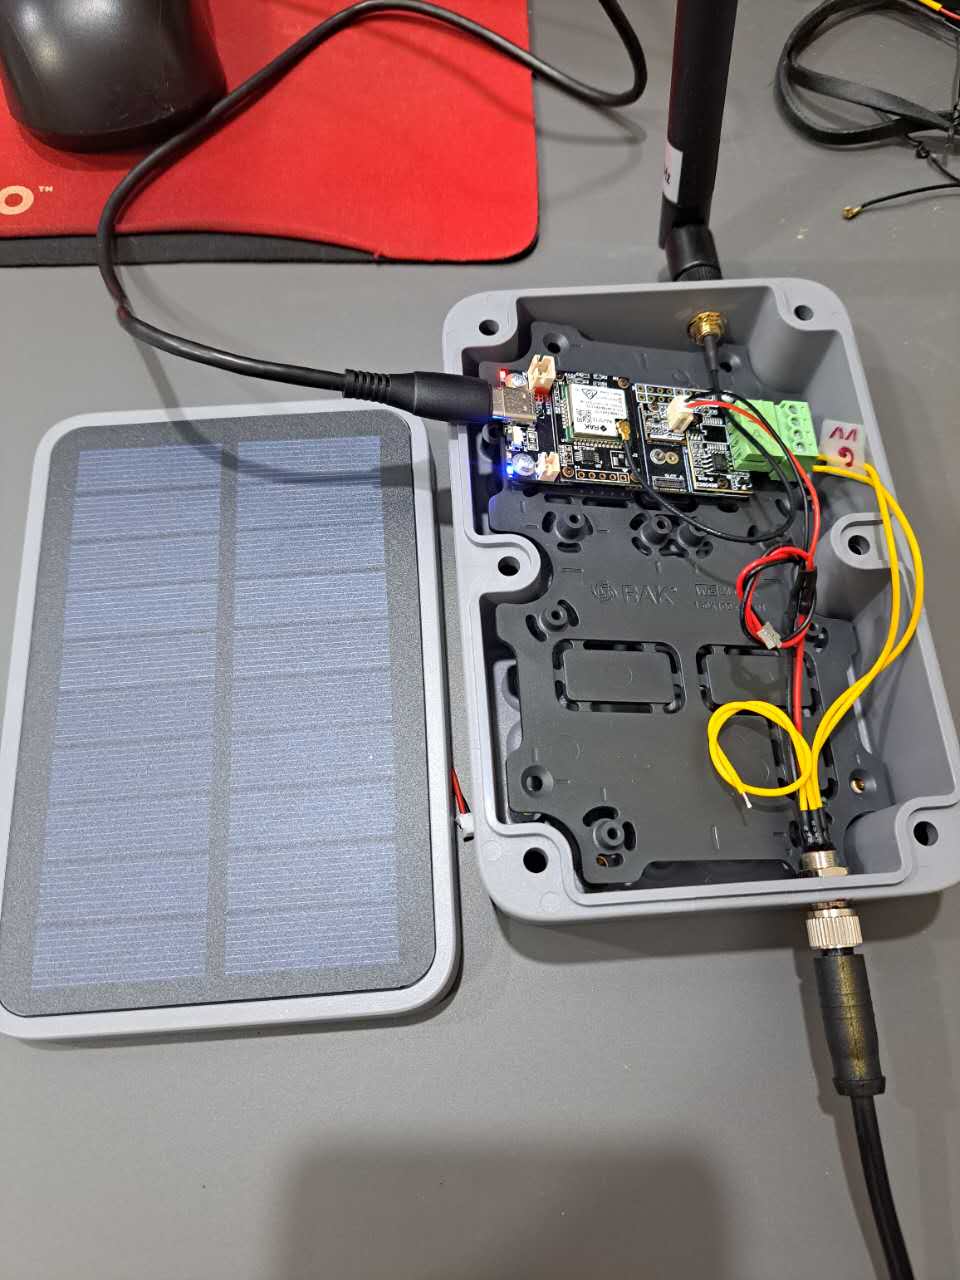     
RAK19002 12V booster must be installed in the Sensor Slot B
Firmware is based on RUI3-RAK5802-Modbus-Master with adjustements for the used RS485 sensor.
To achieve good sensor readings, the sensor is powered up for 5 minutes before the sensor data is read. This gives the sensor time to do the readings and calculations.
Send interval of the sensor values can be set with a custom AT command. Interval time is set in seconds
ATC+SENDINT? Command definition
ATC+SENDINT,: Set/Get the interval sending time values in seconds 0 = off, max 2,147,483 seconds
OK
ATC+SENDINT=? Get current send interval in seconds
ATC+SENDINT=3600
OK
ATC+SENDINT=3600 Get current send interval to 3600 seconds == 1 hour
ATC+SENDINT=3600
OK
Send interval cannot be less than 2 times the sensor power on time. With the current settings the minimum send interval is 10 minutes
Sensor connection can be tested with a custom AT command.
ATC+STEST? Command definition
ATC+STEST,R*W: Read sensor
OK
ATC+STEST=? Start sensor test
ATC+STEST=?
OK
After starting the test, it takes 15-20 seconds before a result is available. The output of the command is:
Sensor found
> atc+stest=?
Sensor Power Up
OK
+EVT:Sensor Values: M:22.10-T:25.70-pH:3.00-C:140.0
The values are soil humidity (M), temperature (T) pH value (pH) and conductivity (C). If the sensor is not in soil, these values might be zeros or not making any sense.
Sensor not found
> atc+stest=?
Sensor Power Up
OK
+EVT:Error reading sensor
Sensor reading already active This can be because a manual started test is not finished yet or the scheduled automatic sensor reading is active
> atc+stest=?
AT_BUSY_ERROR
To control the coils, a downlink from the LoRaWAN server is required. The downlink packet format
isAA55ccddnnv1v2 as hex valuesAA55 is a simple packet markercc is
the command, supported is only MB_FC_WRITE_MULTIPLE_COILSdd is the slave addressnn
is the number of coils to writev1, v2 are the coil status. 0 ==> coil off, 1 ==>
coil on, nn status are expected
To write to registers, a downlink from the LoRaWAN server is required. The downlink packet format
isAA55ccddnnv1v2 as hex valuesAA55 is a simple packet markercc is
the command, supported are MB_FC_WRITE_REGISTER and MB_FC_WRITE_MULTIPLE_REGISTERSdd is the slave
addressaa is the start address of the registers
nn is the number of registers to write
if MB_FC_WRITE_REGISTER
v1 and
v2 is the 16bit value to write to the register
if MB_FC_WRITE_MULTIPLE_REGISTERS
v1
and v2 are the 16bit value to write to the register, nn arrays of v1 and
v2 are expected
To visualize the sensor data, the following (free) extensions are used:
The complete system is setup on a VPS with Docker containers. All required
Docker containers are installed with a custom Docker YAML file and for maintaining of the containers I use Portainer, a Docker management tool.
This includes the Chirpstack V4 LoRaWAN server, InfluxDB and Grafana.
No detailed instructions for this part, these steps are common steps to connect sensor nodes to a LoRaWAN server
(1) Setup the LoRaWAN server and connect the gateway(s) to it. Make sure both LoRaWAN server and the gateway(s) are
setup to the same LoRaWAN region.
(2) Setup an application on the LoRaWAN server
(3) Setup the sensor nodes in
the application with their DevEUI, AppEUI and AppKey (if OTAA is used) or with their DevAddress, AppSKey and NwSKey
(if ABP is used)
(4) Check if the sensor data are received by the application in the LoRaWAN server
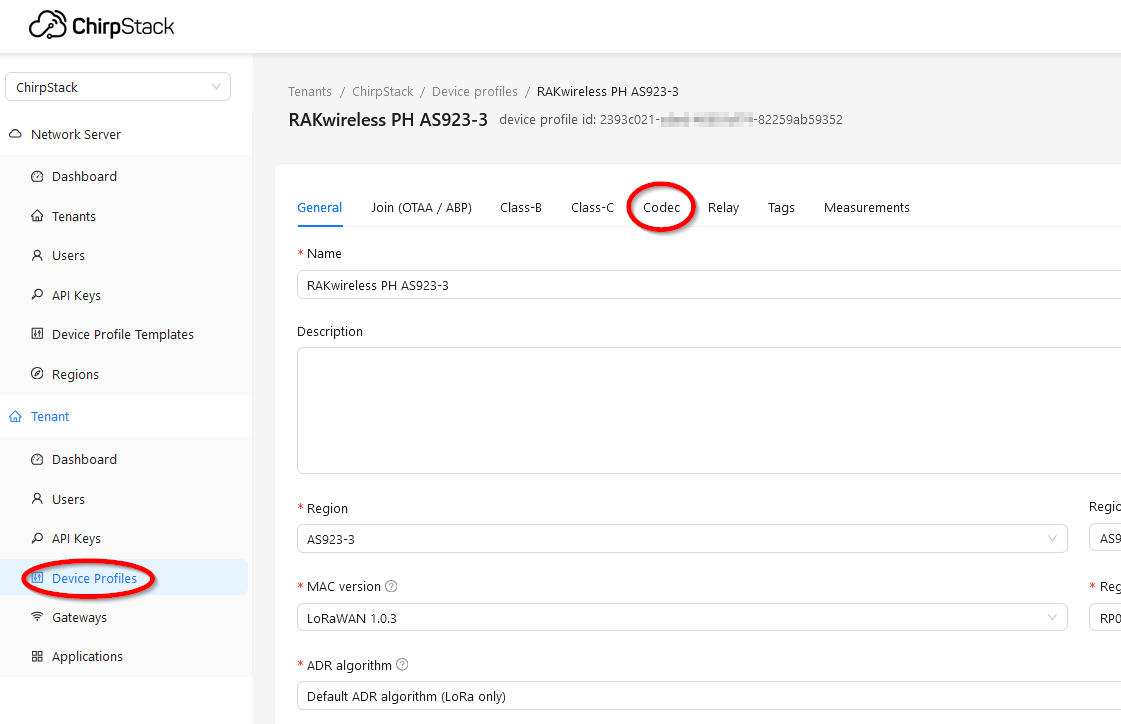
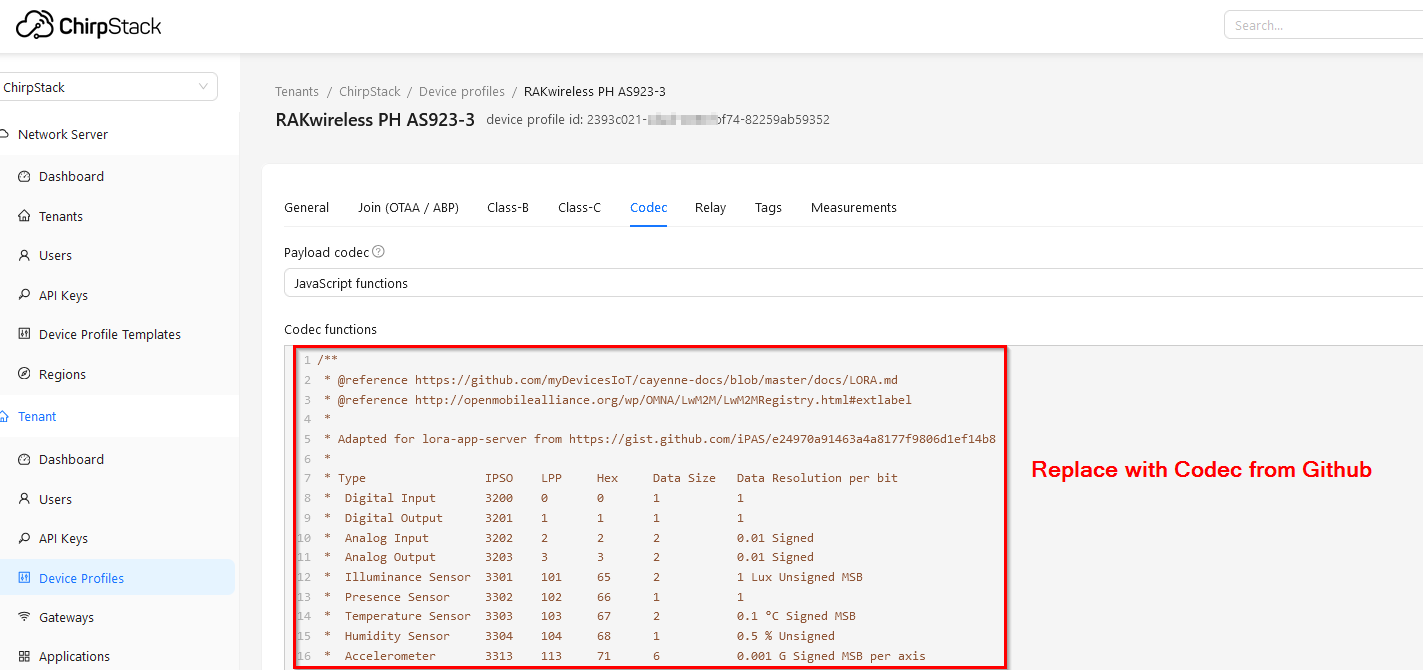
To receive the data in the influxDB database, a payload decoder is required in Chirpstack. Payload decoders are setup in the Device Profiles in Chirpstack. In the Chirpstack web UI switch to the Device Profiles and select Codecs.
Open the Codec tab. By default the Payload codec is set to None. Change it to JavaScript functions
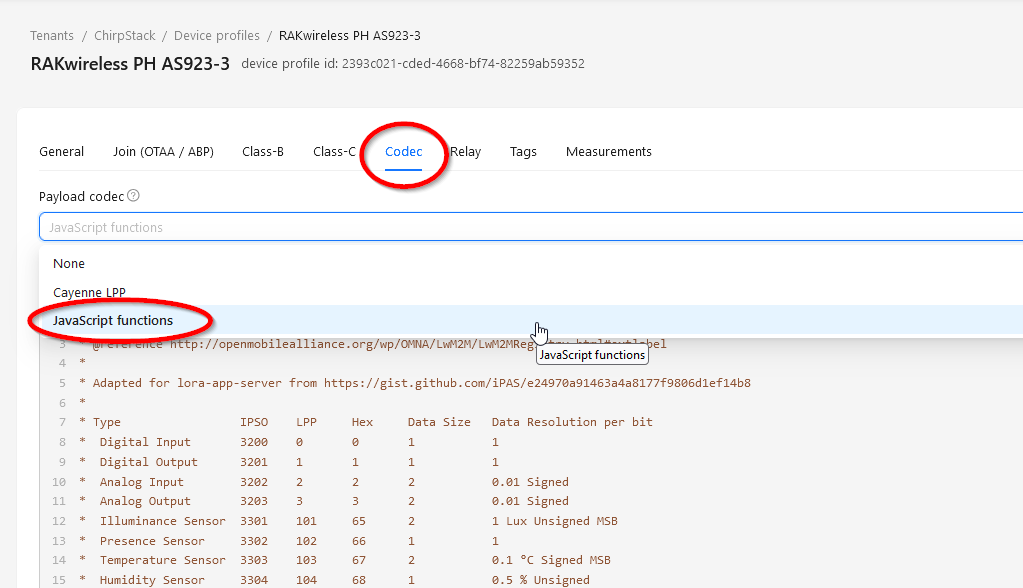
RAKwireless has a ready to use JavaScript decoder for Chirpstack. You can get it from the RAKwireless_Standardized_Payload Github repository.
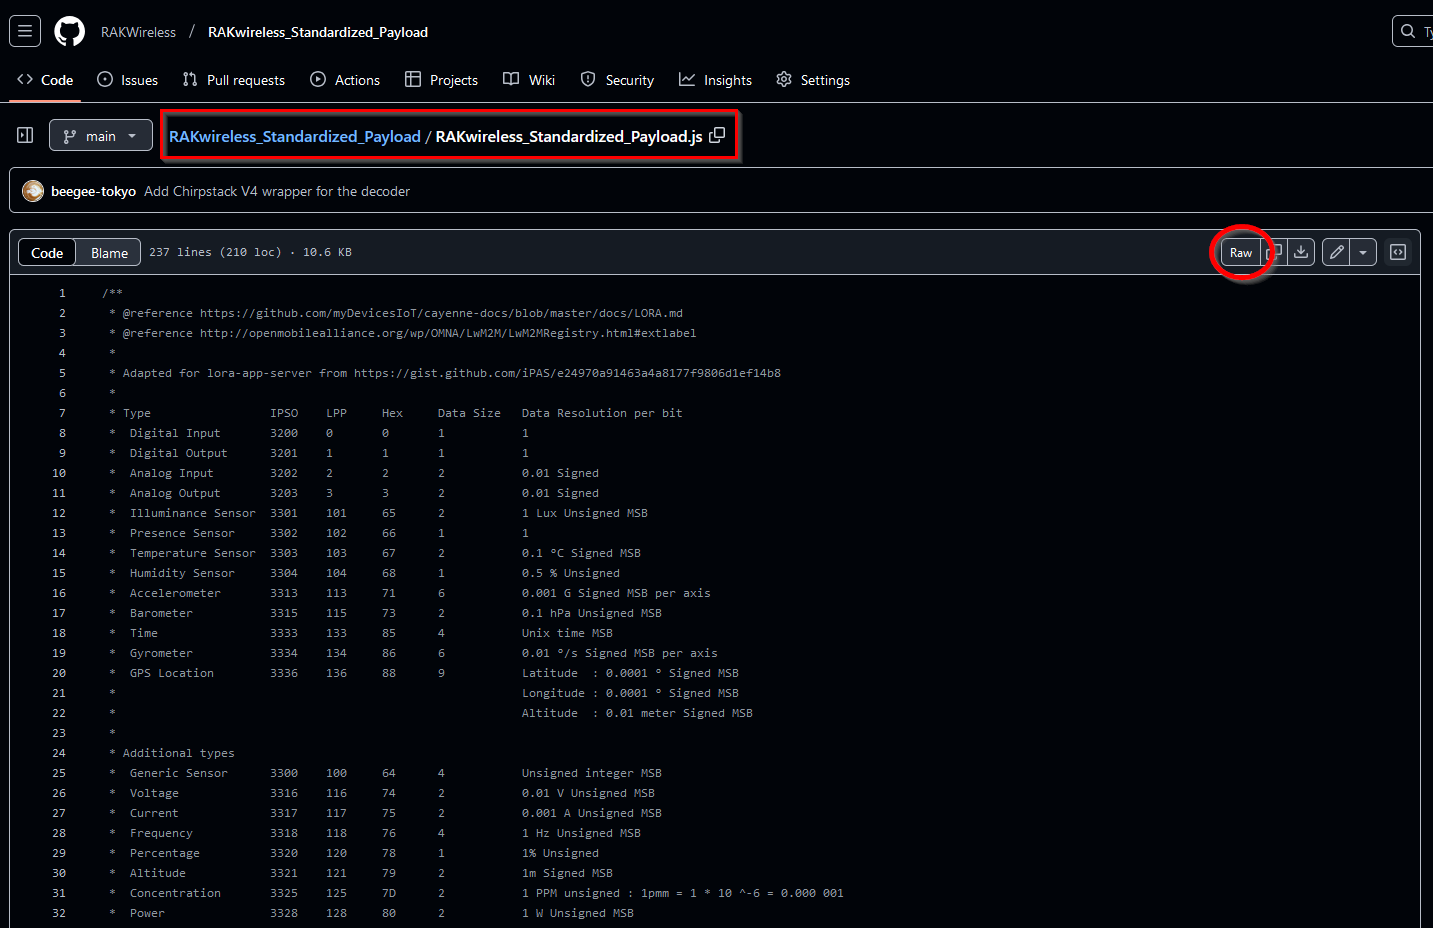
Use the Raw button to see the Javascript as plain text. Copy the complete Javascript code and paste it into the Chirpstack Codec functions text field.
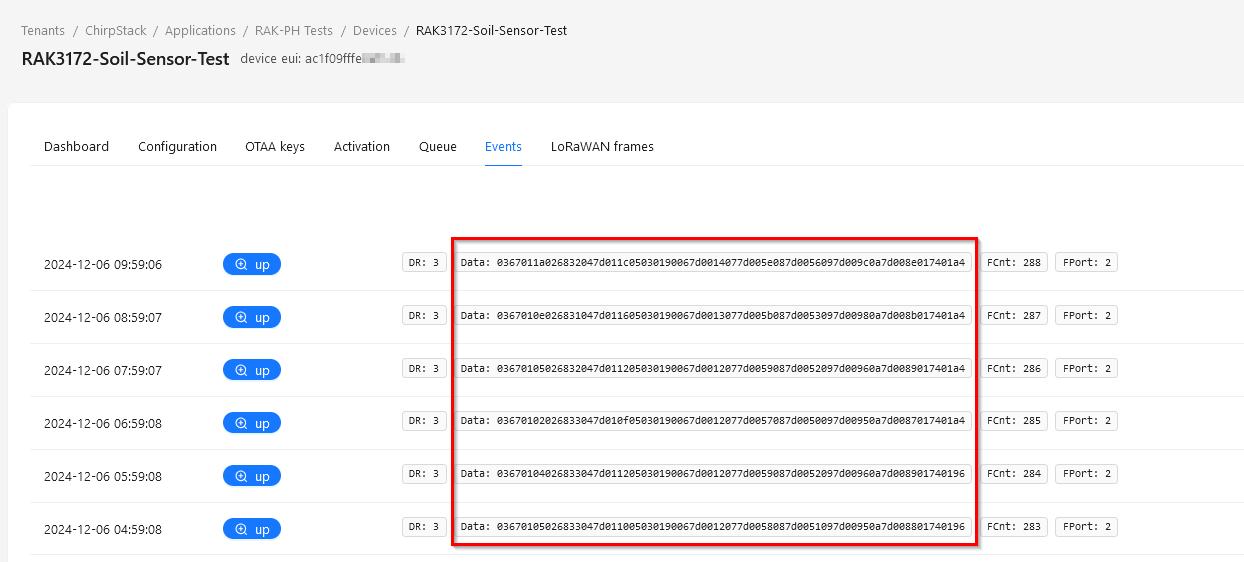
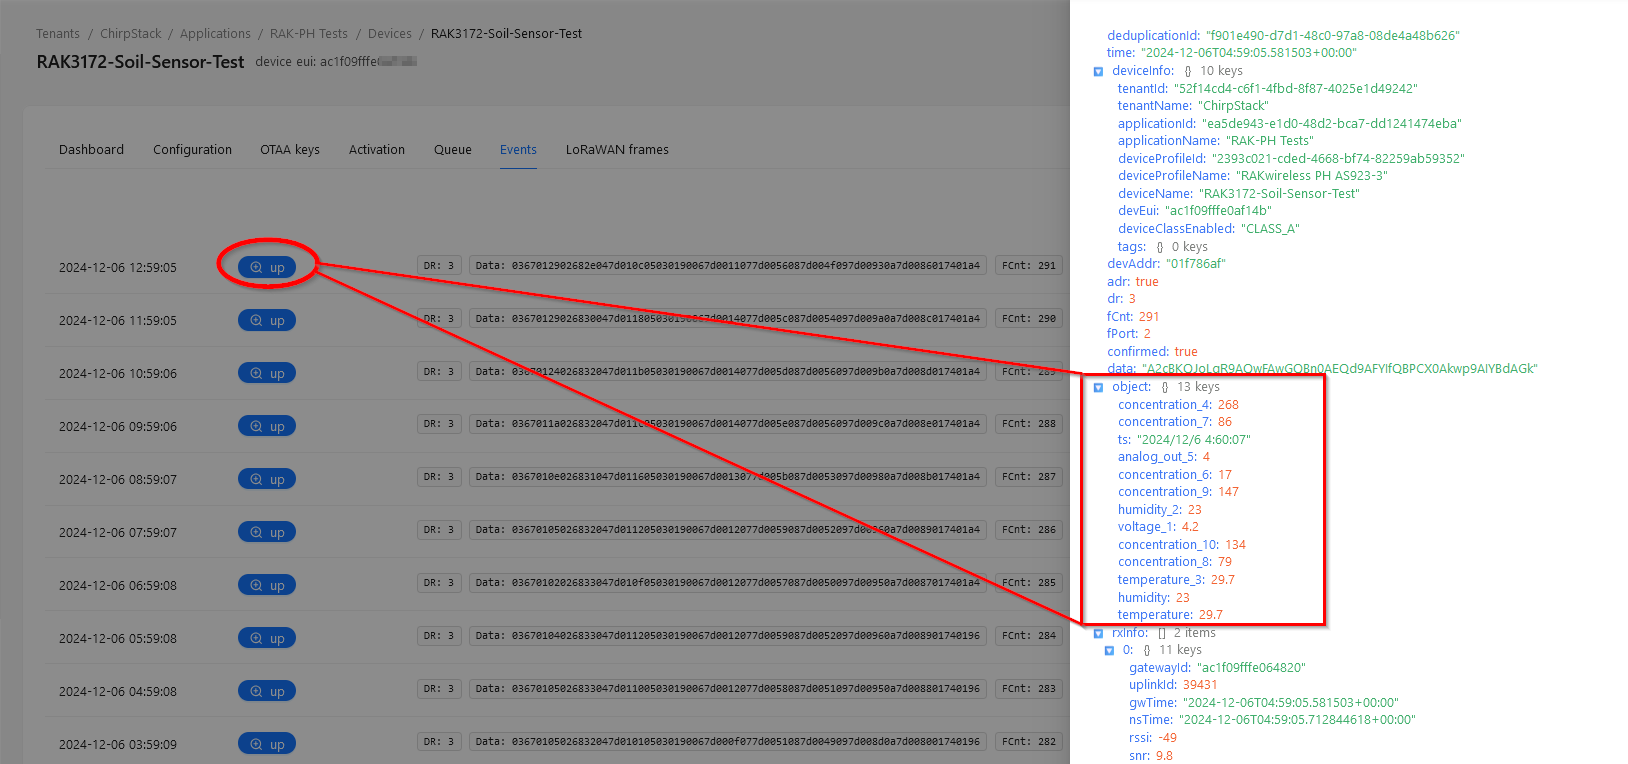
To check that the decoder is working, go back to the device in Chirpstack and select
Events. This will show the received data.
Click on the up
button of a received packet and the decoded payload will be shown:
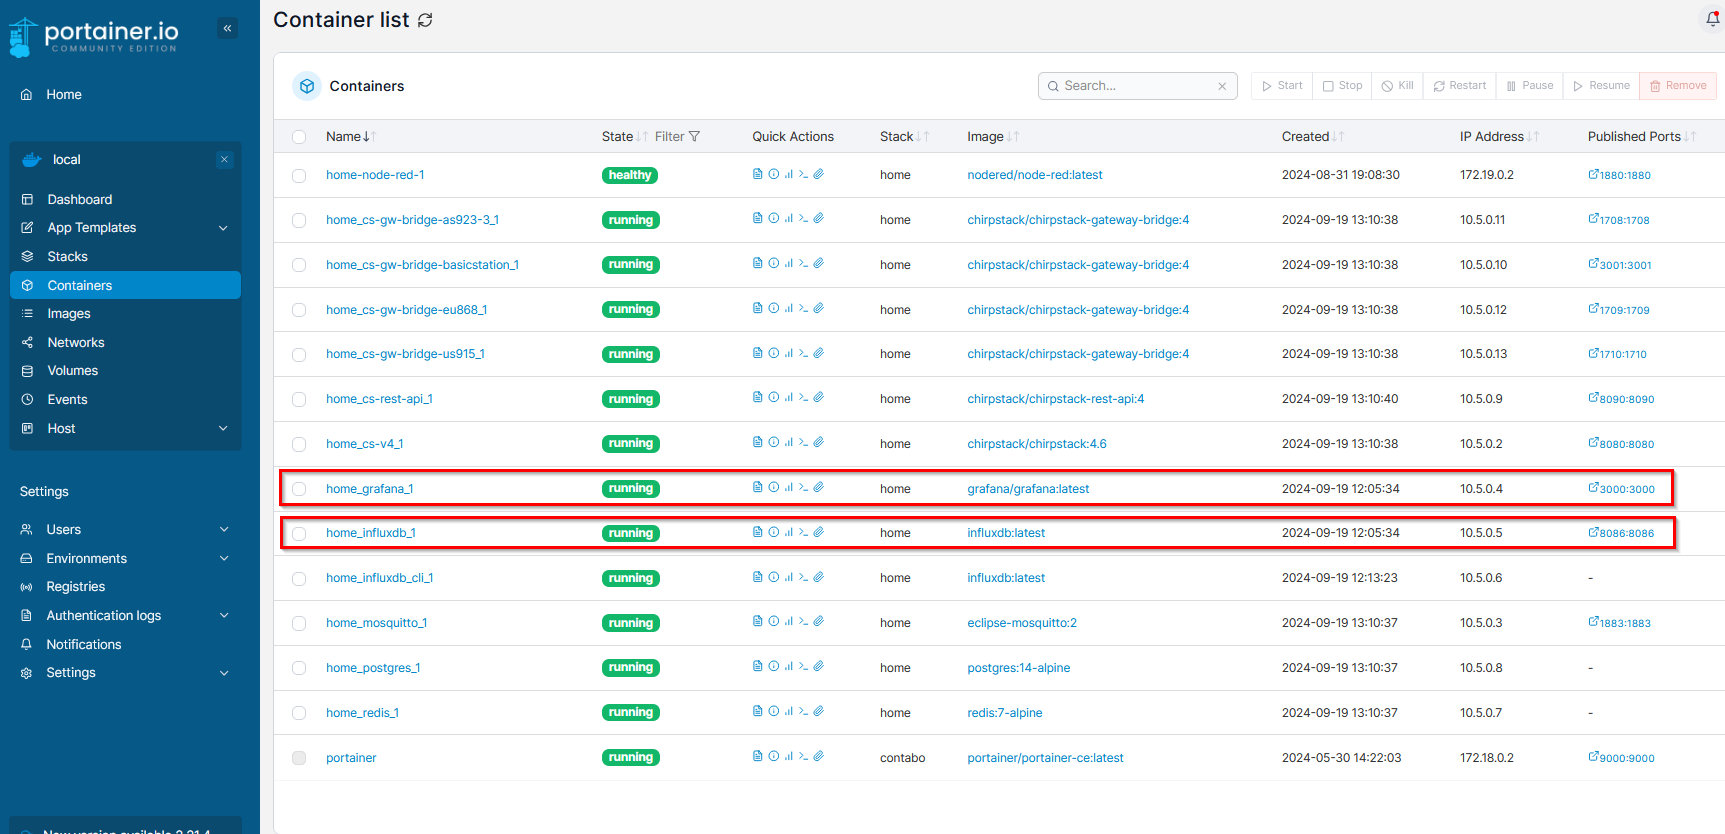
The installation of InfluxDB and Grafana is done through the Docker YAML file.
Important are the local IP
addresses of the two applications, which can be obtained through the Portainer management tool.
In InfluxDB web UI, create an access token to allow access.
(1) Open the Load Data menu and select API Tokens
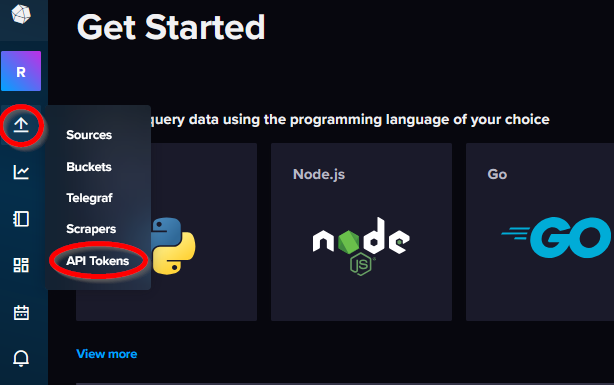
(2) Create two tokens using the GENERATE API TOKEN button, one for Chirpstack and one for Grafana.
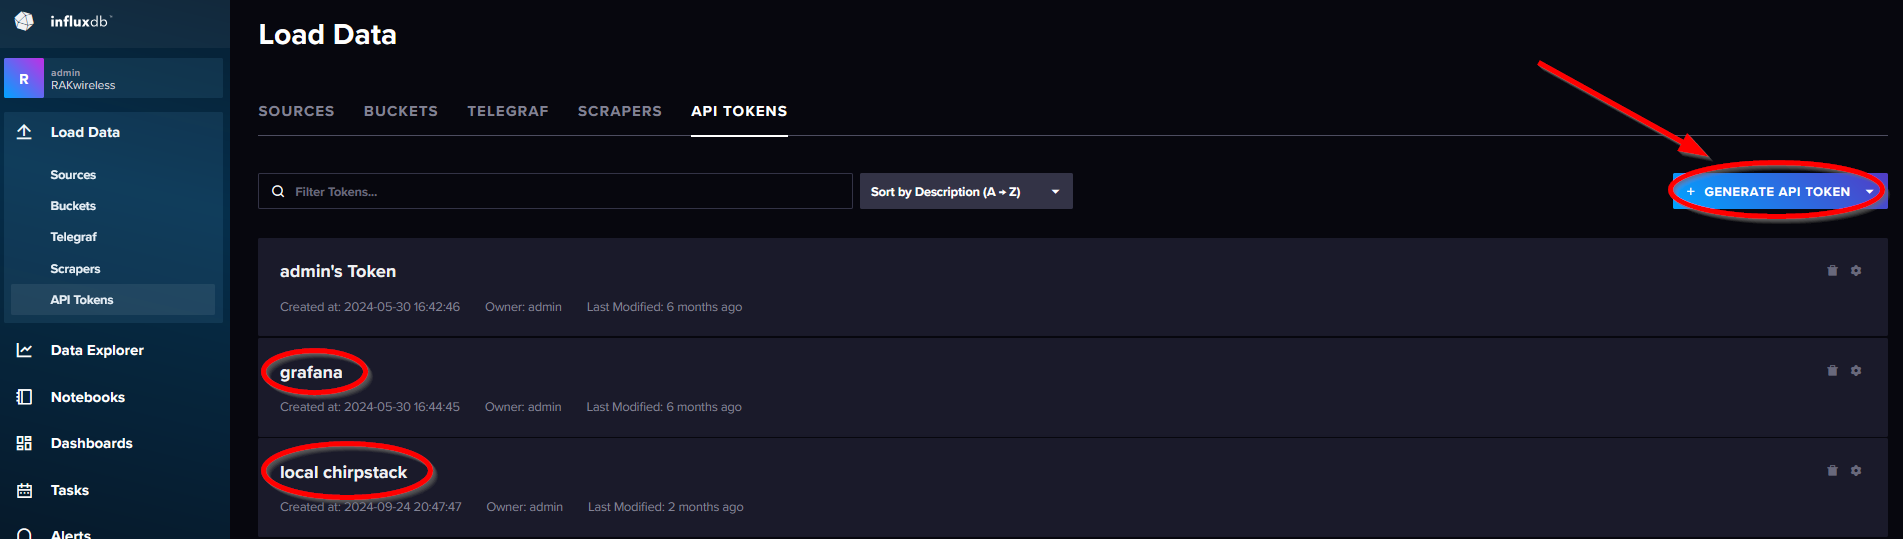
These tokens will be required in the next steps!
Make sure to copy the tokens into a safe place. They can be only read during the creation of the tokens.
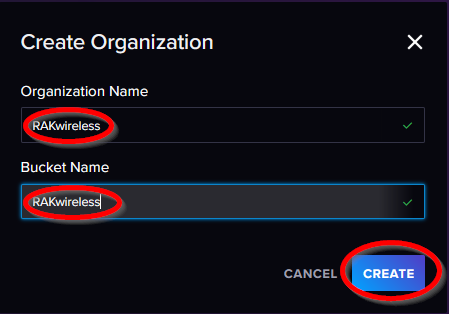
Create an organization and a bucket for the sensor data.
(3) Create organization and a bucket
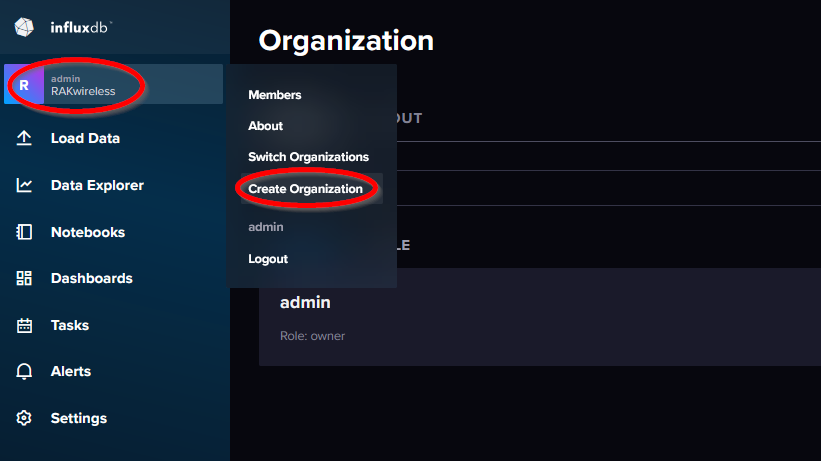
Here we use RAKwireless for both the organization and the bucket.
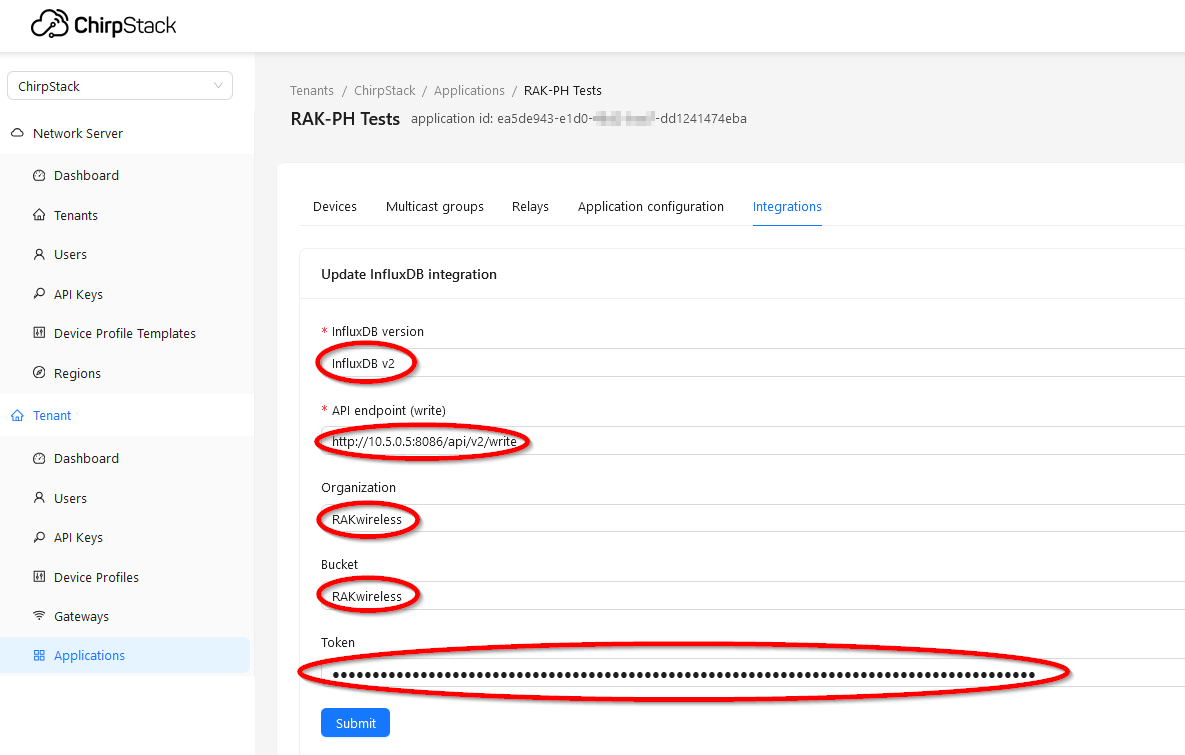
In the Chirpstack web UI, open the application and select the Integrations tab:
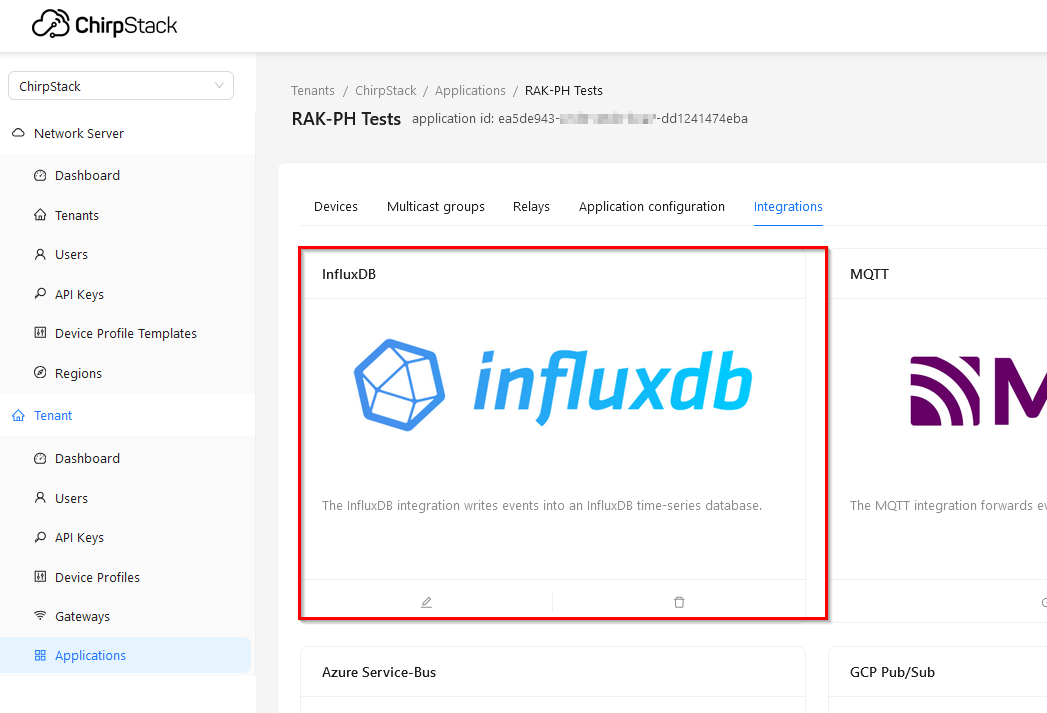
Then fill out the connection details to the InfluxDB database.
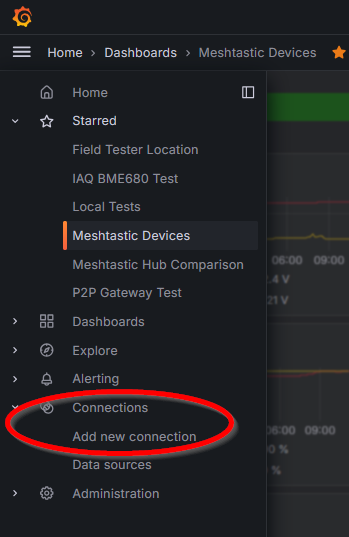
In the Grafana web UI, open Connections, then Add new connection to setup the connection to the influxDB database.
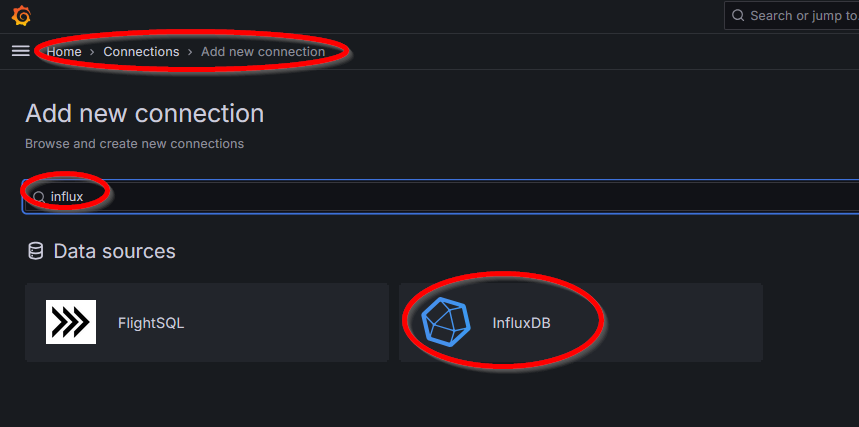
Select InfluxDB as new connection.
Setup the connection using the IP address and token obtained earlier
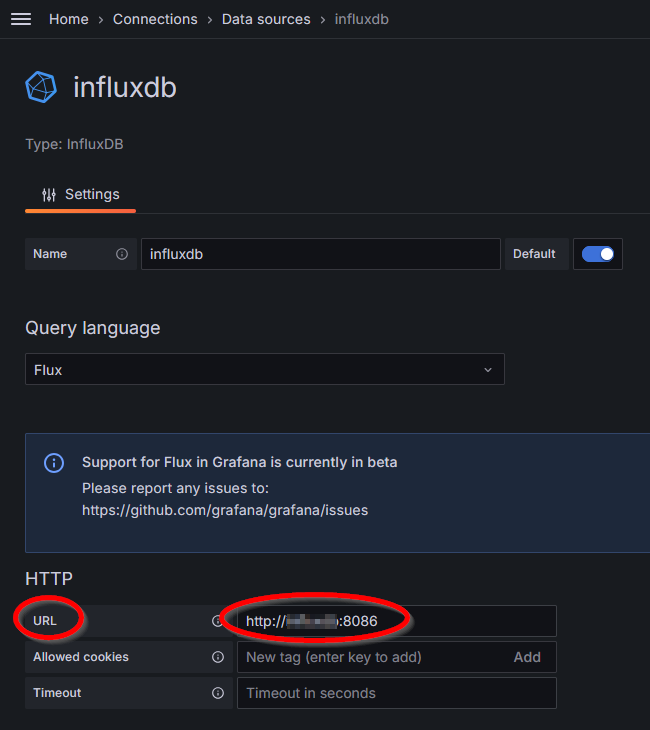
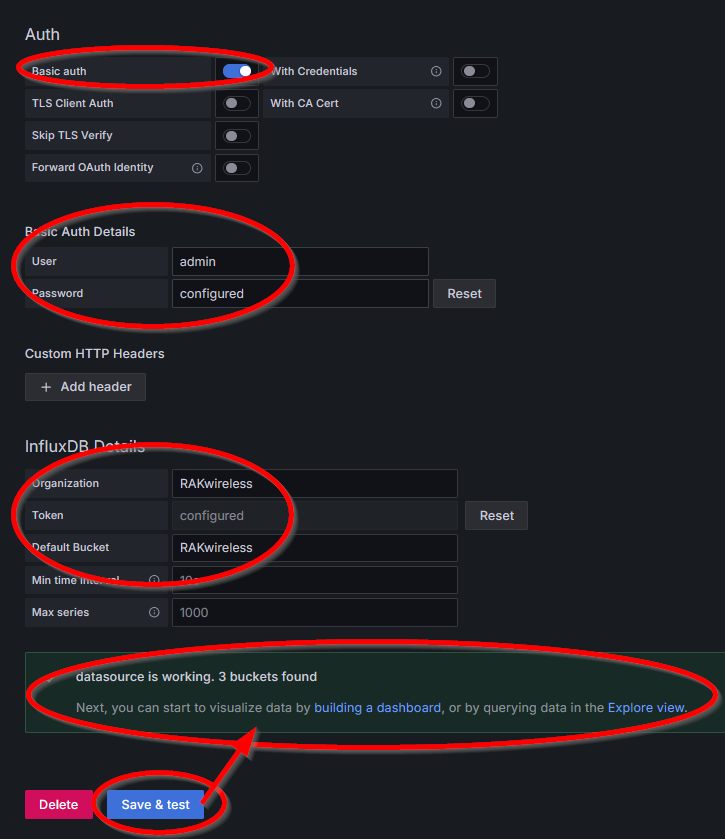
Use the Save & test button to check if Grafana can access the database.
Open the influxDB web UI and open the Data Explorer.
Select the correct bucket.
The easiest way to find the data is to use soil sensors DevEUI as the first filter.
Then use
_measurement as the second filter. You will see now all the data that was received from the soil
sensor.
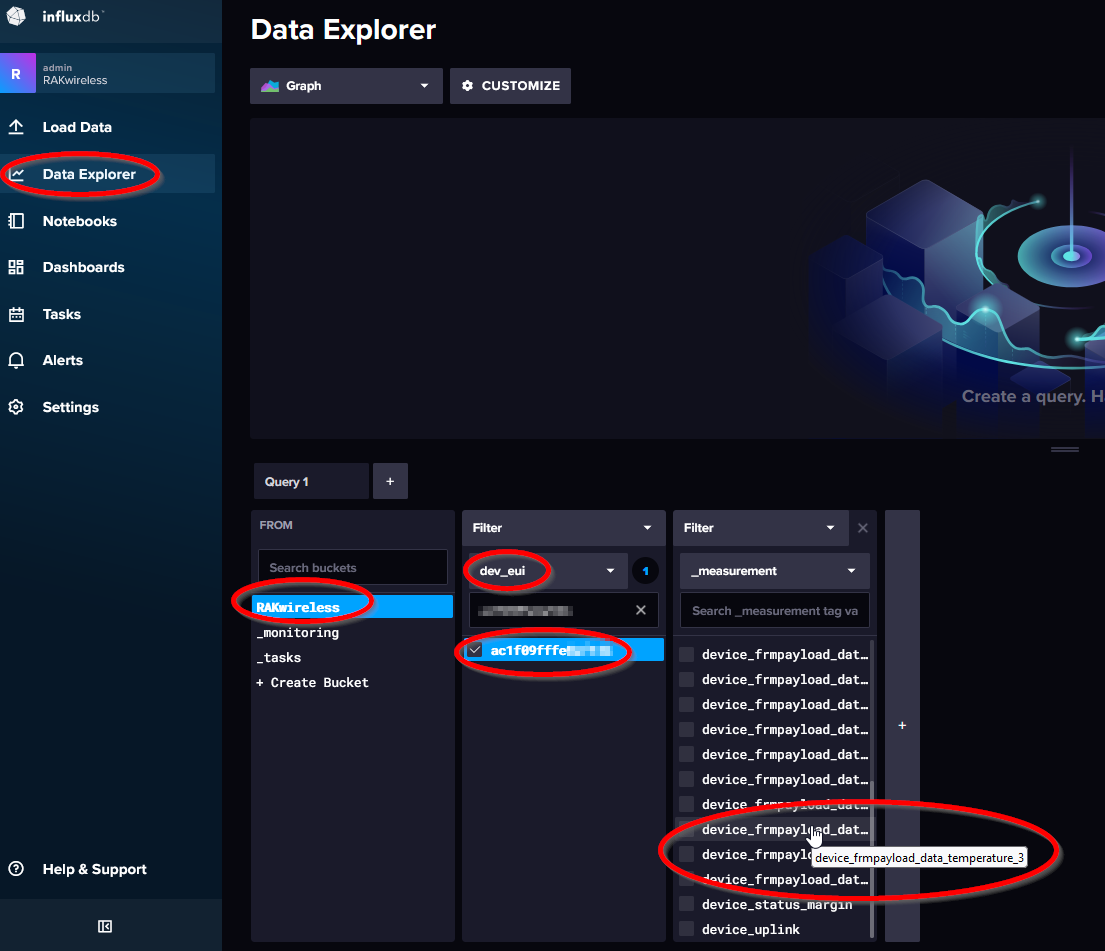
As you can see, there are many entries. Each entries name has the sensor number at the end we assigned in the application code.
// Cayenne LPP Channel numbers per sensor value
#define LPP_CHANNEL_BATT 1 // Base Board
#define LPP_CHANNEL_MOIST 2
#define LPP_CHANNEL_TEMP 3
#define LPP_CHANNEL_COND 4
#define LPP_CHANNEL_PH 5
#define LPP_CHANNEL_NITRO 6
#define LPP_CHANNEL_PHOS 7
#define LPP_CHANNEL_POTA 8
#define LPP_CHANNEL_SALIN 9
#define LPP_CHANNEL_TDS 10
For example:
_
device_frmpayload_data_temperature_3_
refers to the soil temperature
// Add temperature level to payload
g_solution_data.addTemperature(LPP_CHANNEL_TEMP, coils_n_regs.sensor_data.reg_2 / 10.0);
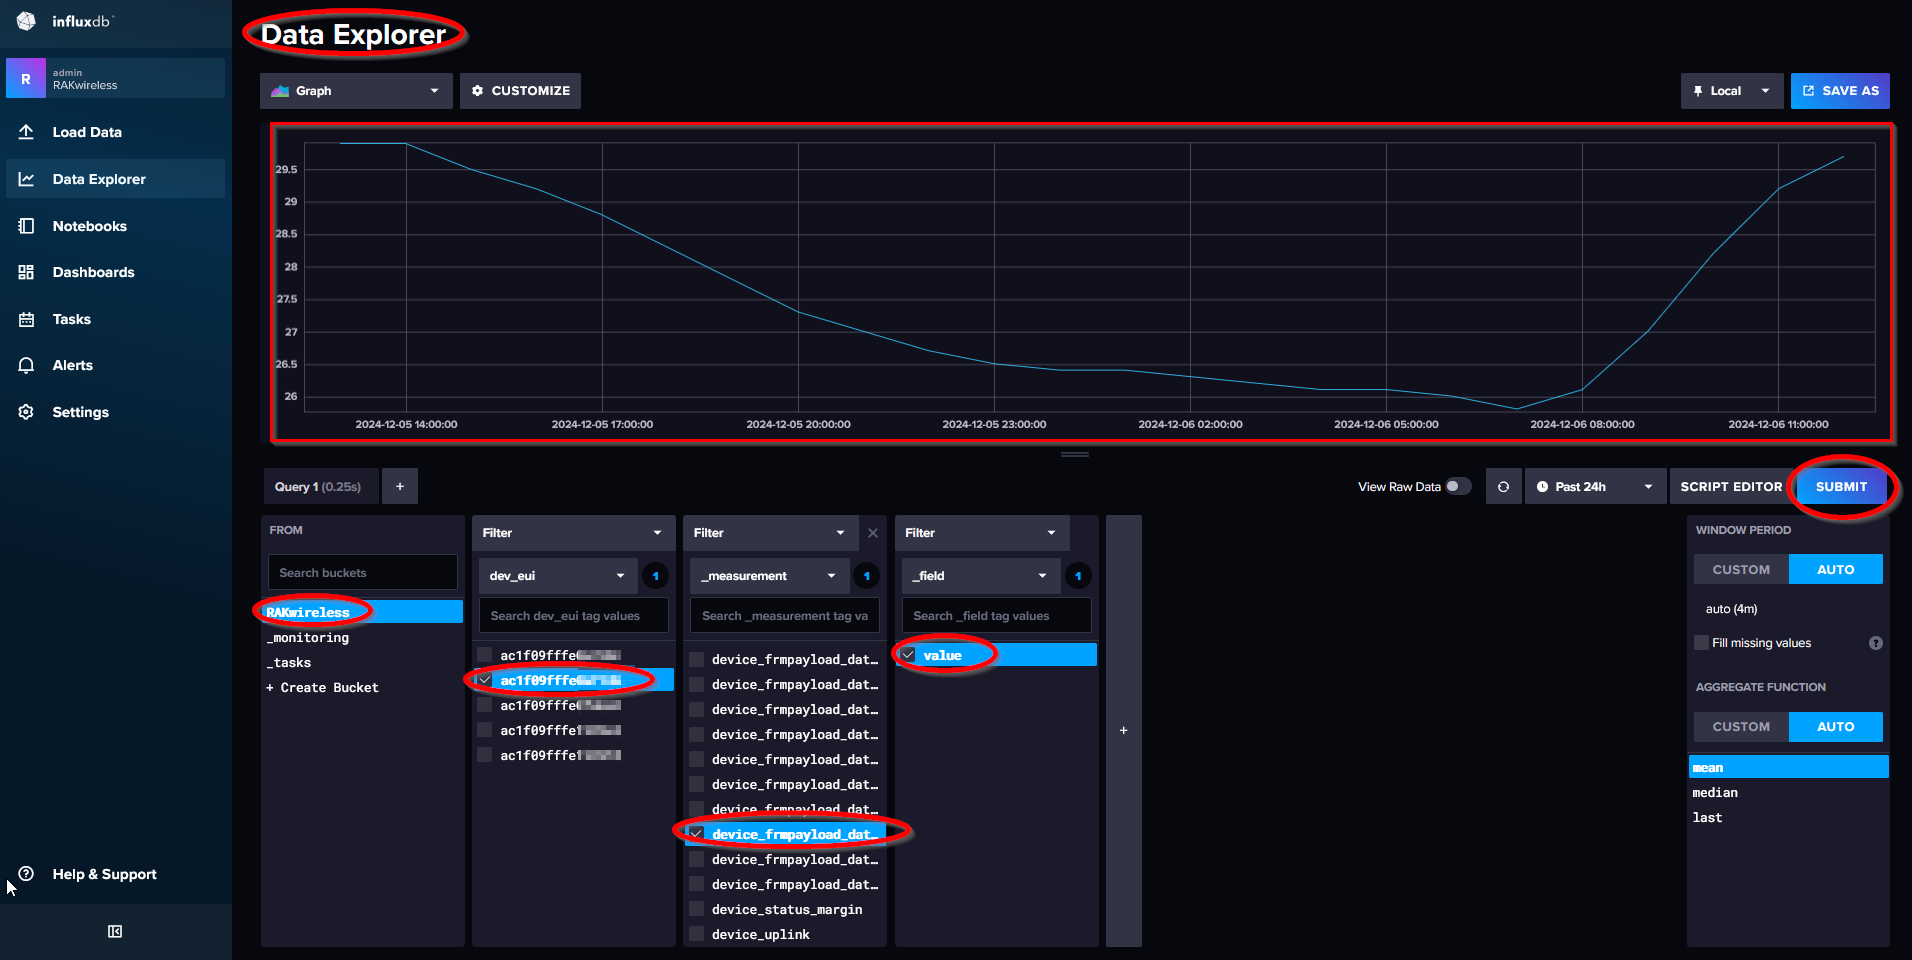
Once device_frmpayload_data_temperature_3 is selected, add one more filter with
value to get the temperature values from the database query. Then push the
SUBMIT button. The graph will show the recorded temperature measurements.
influxDB Data Explorer gives the option to see the query as Flux query. This can be directly used in Grafana to collect the data from the influxDB database.
Push the SCRIPT EDITOR button to see the Flux query.
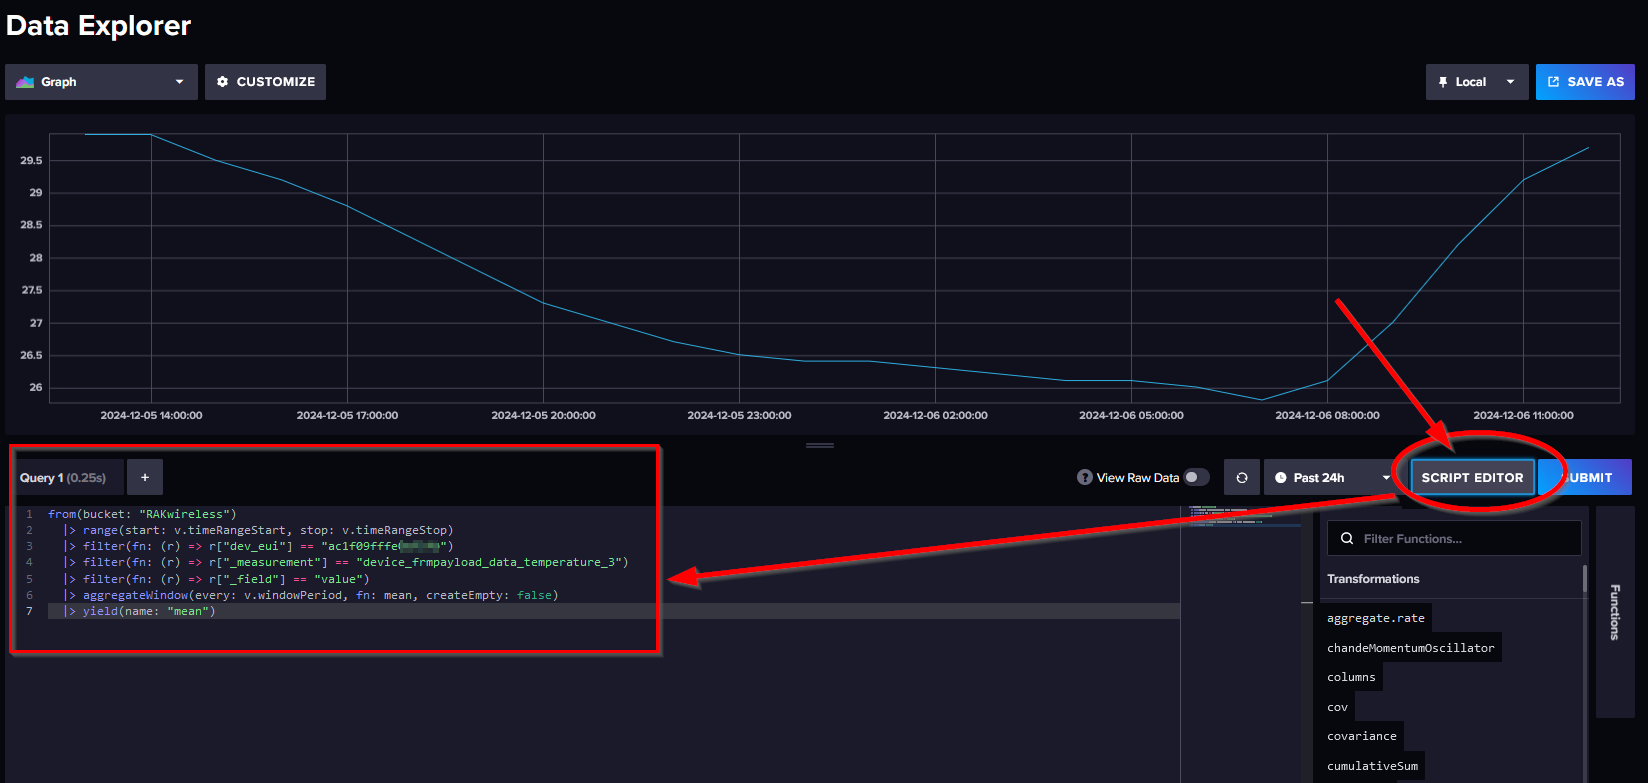
Copy and save the Flux Query, it will be used in the Grafana dashboard later.
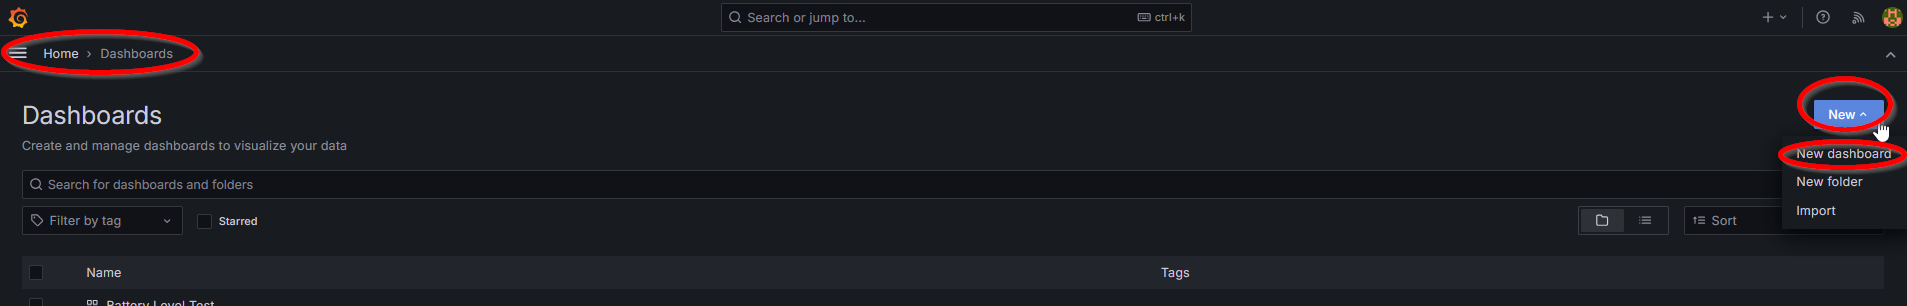
Open the Grafana web UI and go to Home => Dashboards. Then click on the New button and select New dashboard.
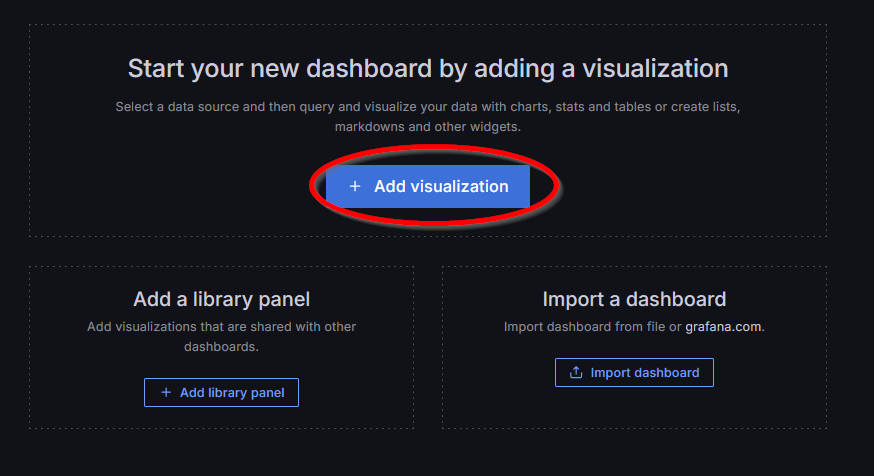
On the next window select the option to Add visualization
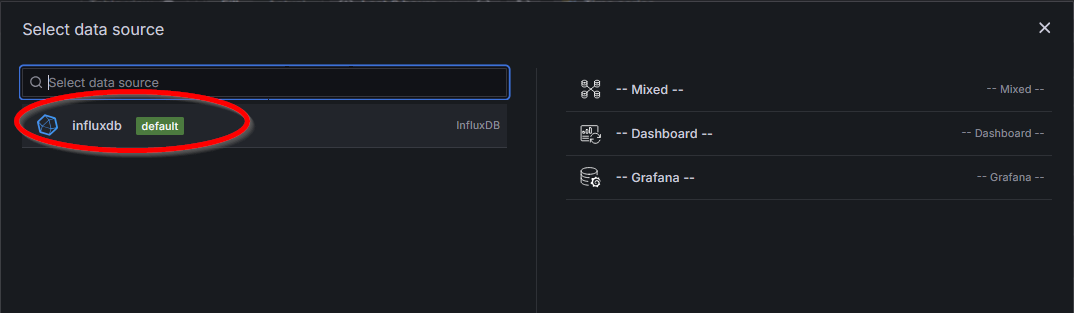
Then select influxdb as the data source.
A new window with the visualization details will be shown.
Take the Flux query copied from influxDB DataExplorer
earlier and copy it into the query field.
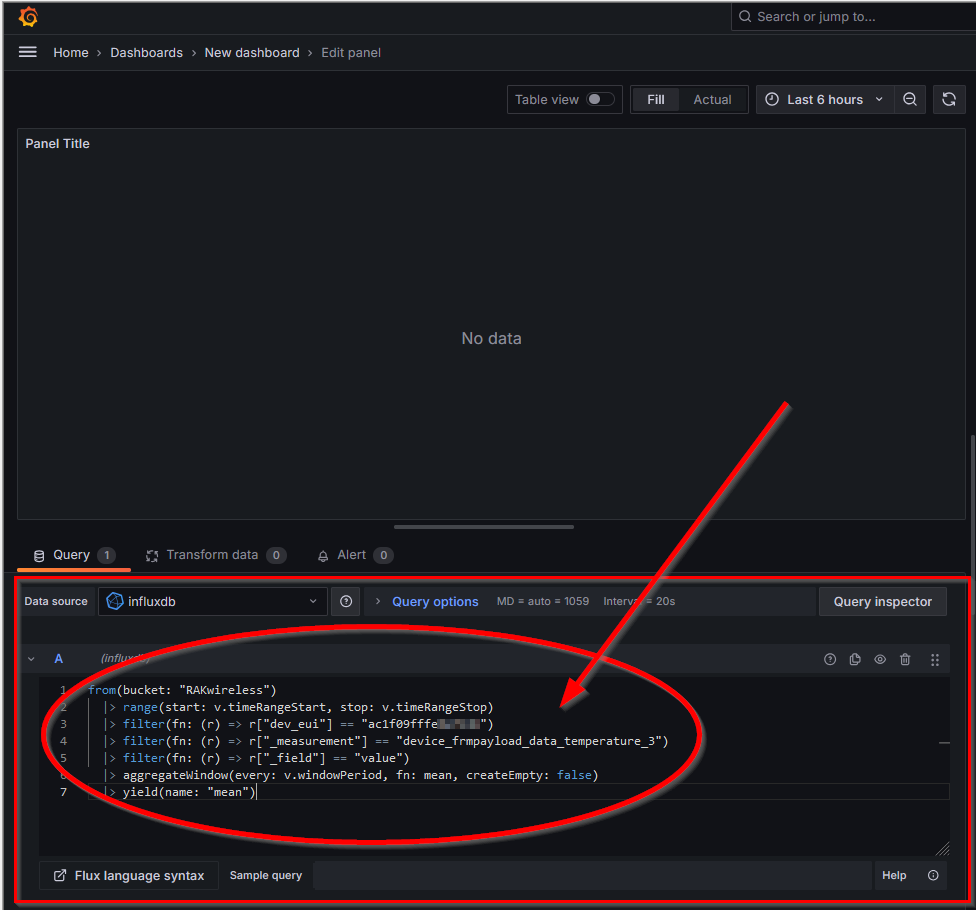
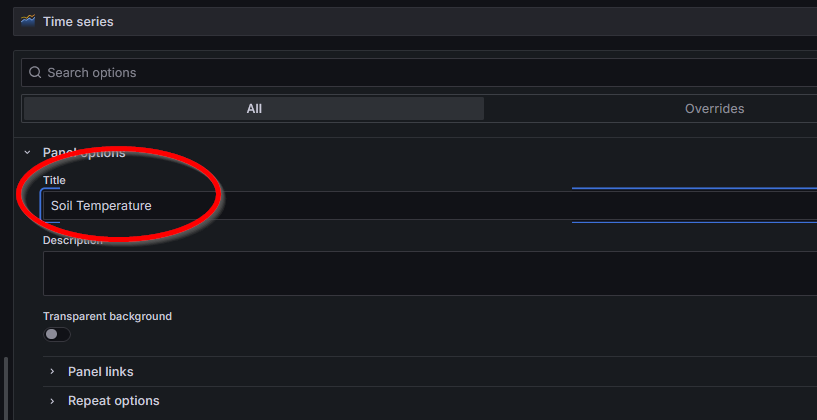
There are many options to change how the data will be presented. Here only the Panel Title is changed to Soil Temperature. The Grafana documentation explains the other options.
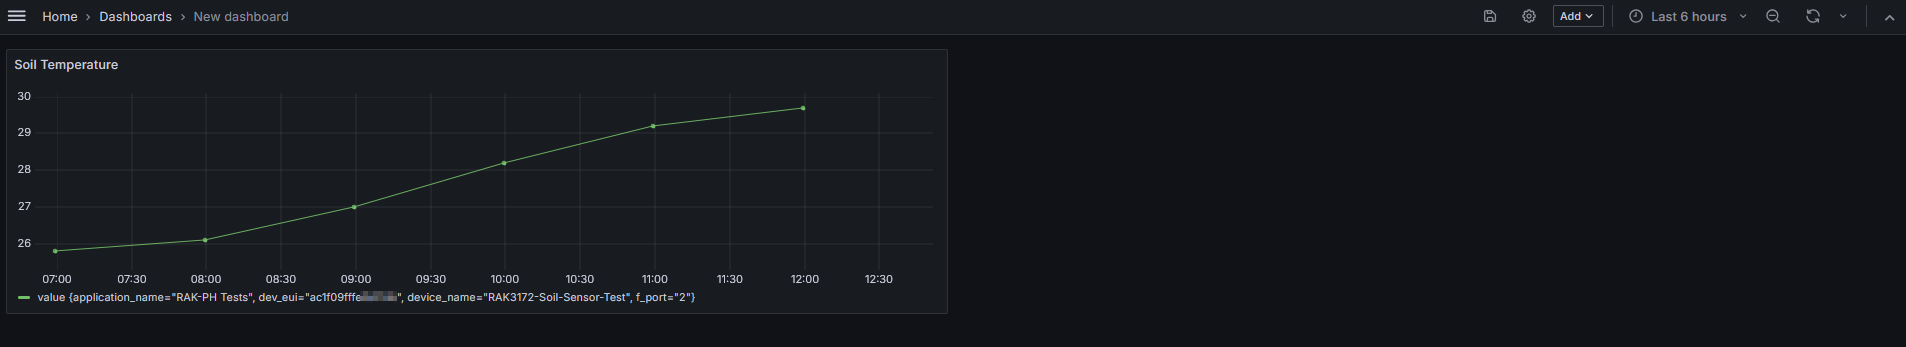
Push the Apply button to add the visualization to the new Dashboard.

Now the panel with the soil temperature is shown in the dashboard.
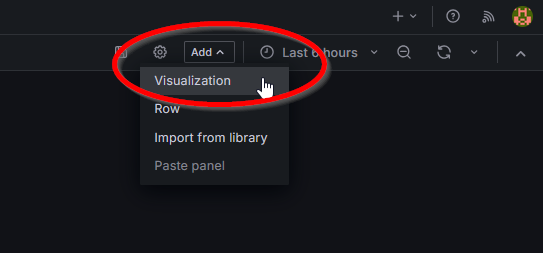
To add the other sensor values, there are two ways:
use the Add => Visualization option from the top menu and repeat the above steps for the new sensor value
duplicate the existing visualization and just change the title and Flux query
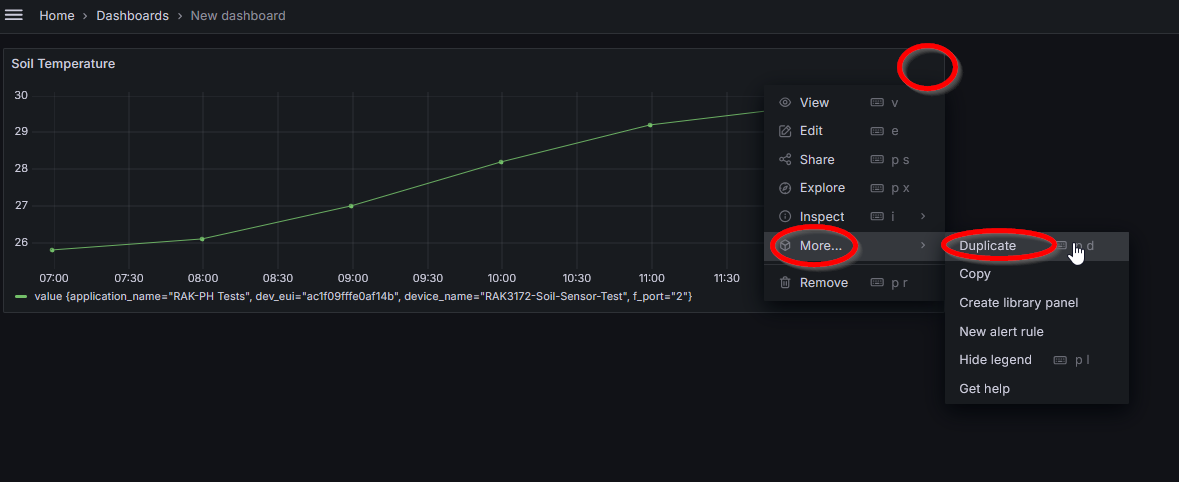
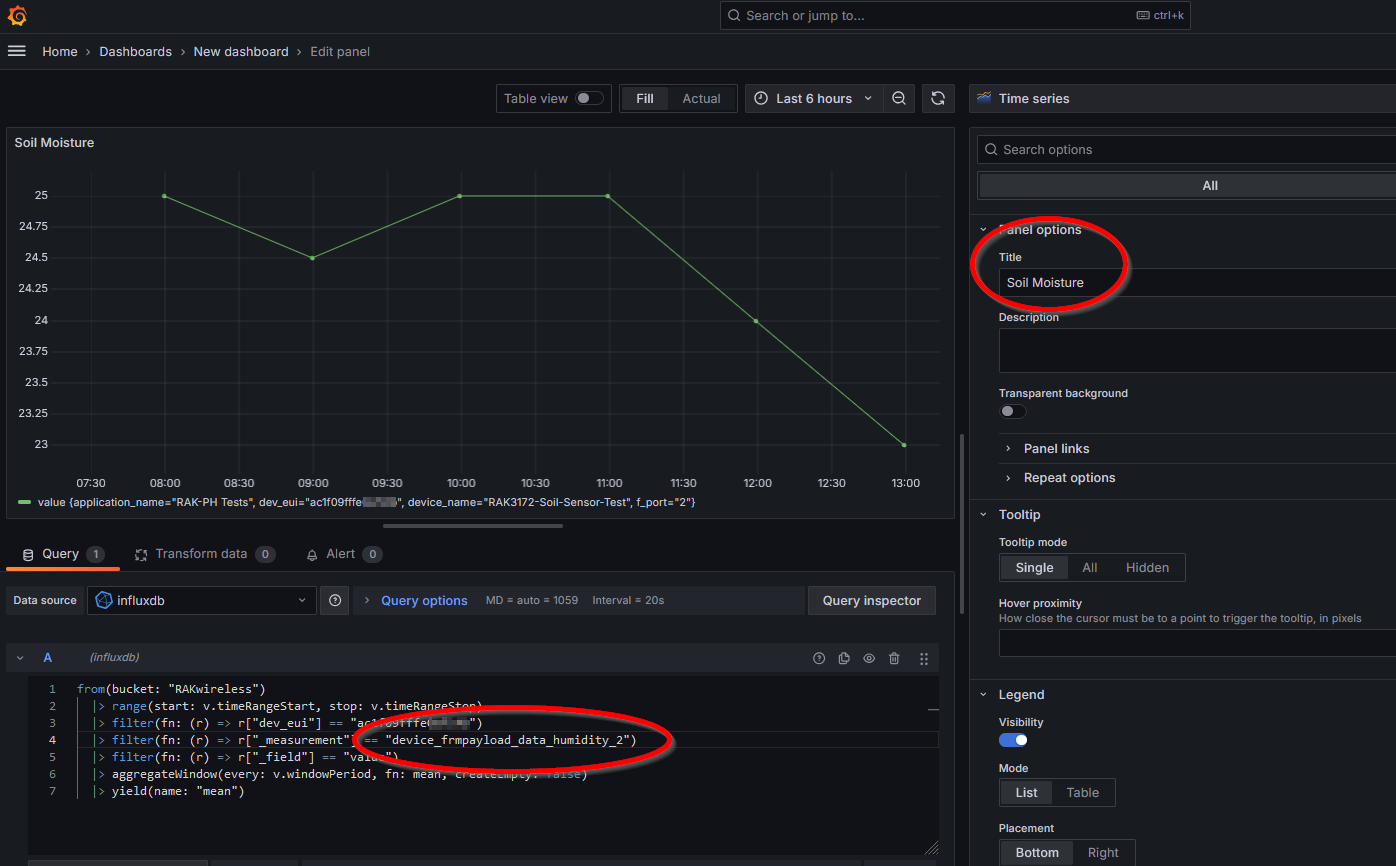
If Duplicate is chosen, open the visualization menu and select Edit.
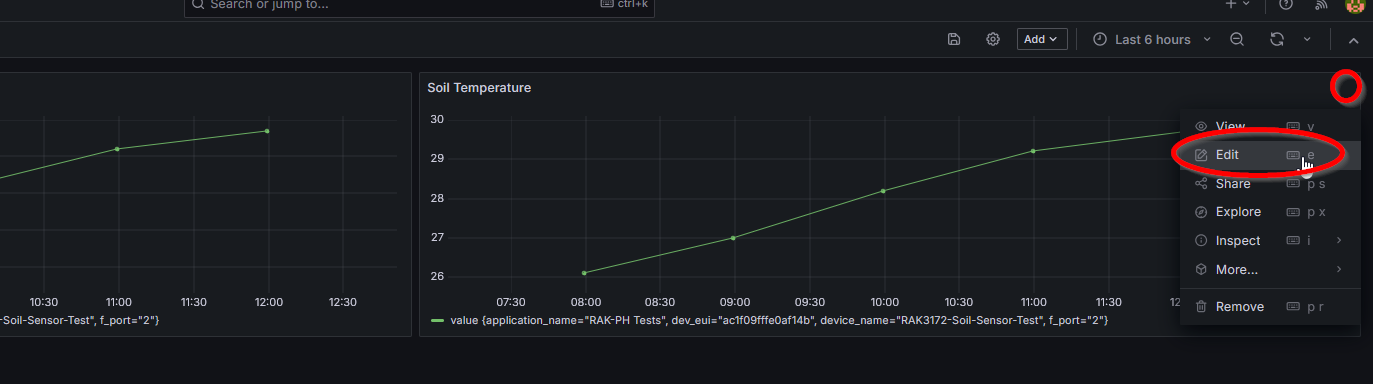
In the edit window only two things need to be changed, the source in the Flux query and the title. Here the source is
changed to the moisture level (device_frmpayload_data_humidity_2) and title to
Soil Moisture
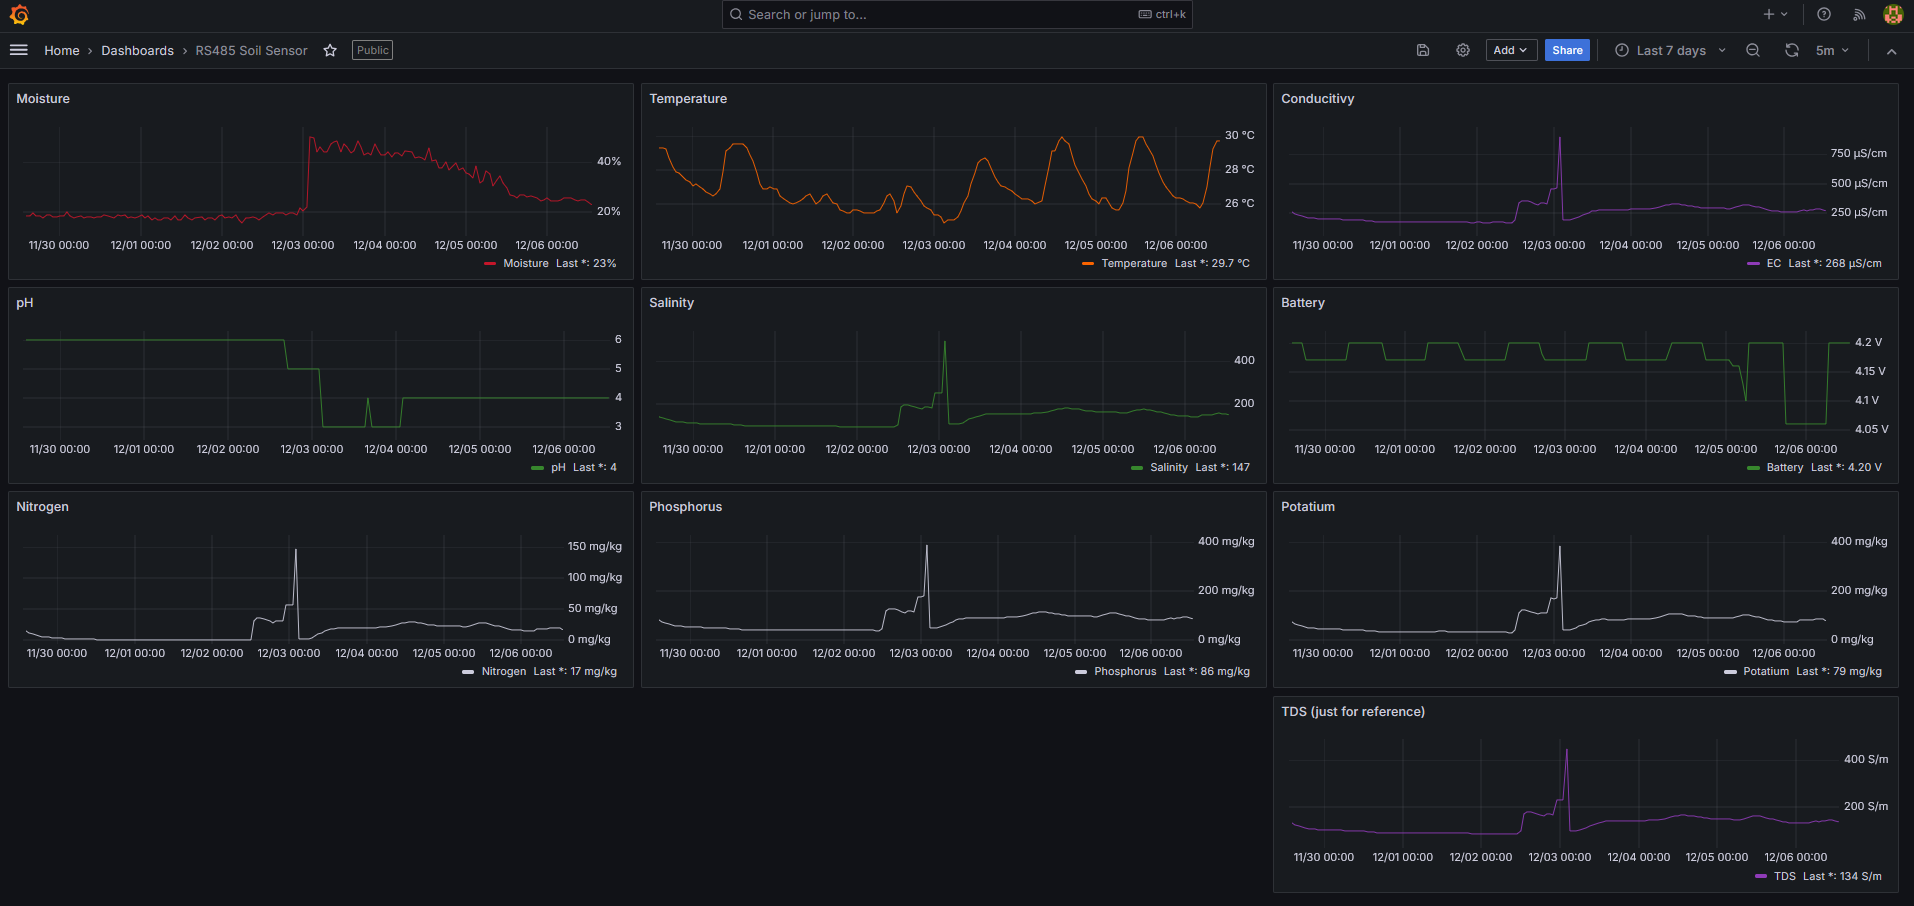
Other sensor values can be added to the Dashboard the same way. When all sensor values are visualized, the Dashboard will look like this: