


|
|
|
|---|---|---|
While Meshtastic is known as a communication tool to send messages over a LoRa based mesh network, it has as well built-in functions to read sensors and share the sensor values.
What we want to show in this proof of concept is a scenario where multiple sensor nodes can connect over the mesh
network to a "gateway" which transmits the sensor data to a MQTT broker.
From the MQTT broker, the data
is retrieved via a NodeRED flow and send to an InfluxDB database.
For visualization, the InfluxDB database is
connected to an Grafana instance.
The WisMesh Basic Device Setup Guide is a step by step guide to setup WisMesh Meshtastic devices for the Meshtastic Network.
The WisMesh MQTT Gateway Setup Guide is a step by step guide to setup WisMesh Meshtastic devices as gateways from the Meshtastic Network to a MQTT broker.
For this PoC, we connect four meshtastic devices to each other.
All above listed devices running the "standard" Meshtastic firmware with one exception.
The RAK11200 is
running a "bug-fixed" version of the Meshtastic firmware.
While setting up the device I found two problems with the data sent to the MQTT broker.
(1) When using protobuf packets, the IAQ level of the RAK1906 could not be found by the NodeRED Meshtastic decoder
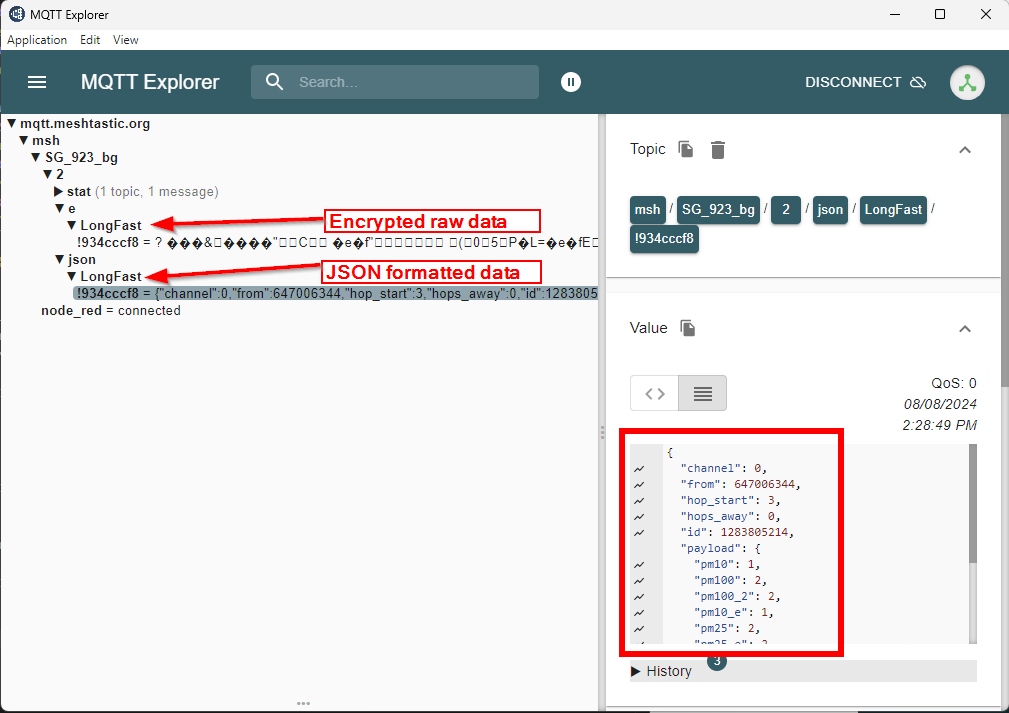
(2) When using JSON formatted packets, the sensor data of the particulate matter sensor was not included in the data sent to the MQTT broker.
As in this PoC the JSON formatted data is used (easier to handle in NodeRED), the problem with the JSON formatted data was fixed in the Meshtastic sources and a custom version was compiled for the RAK11200. The required changes are reported in Meshtastic Github as issue #4390.
As mentioned, the devices are flashed with "standard" Meshtastic firmware. The difference between the devices is in the setup.
The setup of each device is done with the Meshtastic mobile application (here the Android version was used). Alternative the setup could be done with the Meshtastic WebUI or the Meshtastic command line tool.
In the Meshtastic app, in the first step, all devices should be connected to the app:
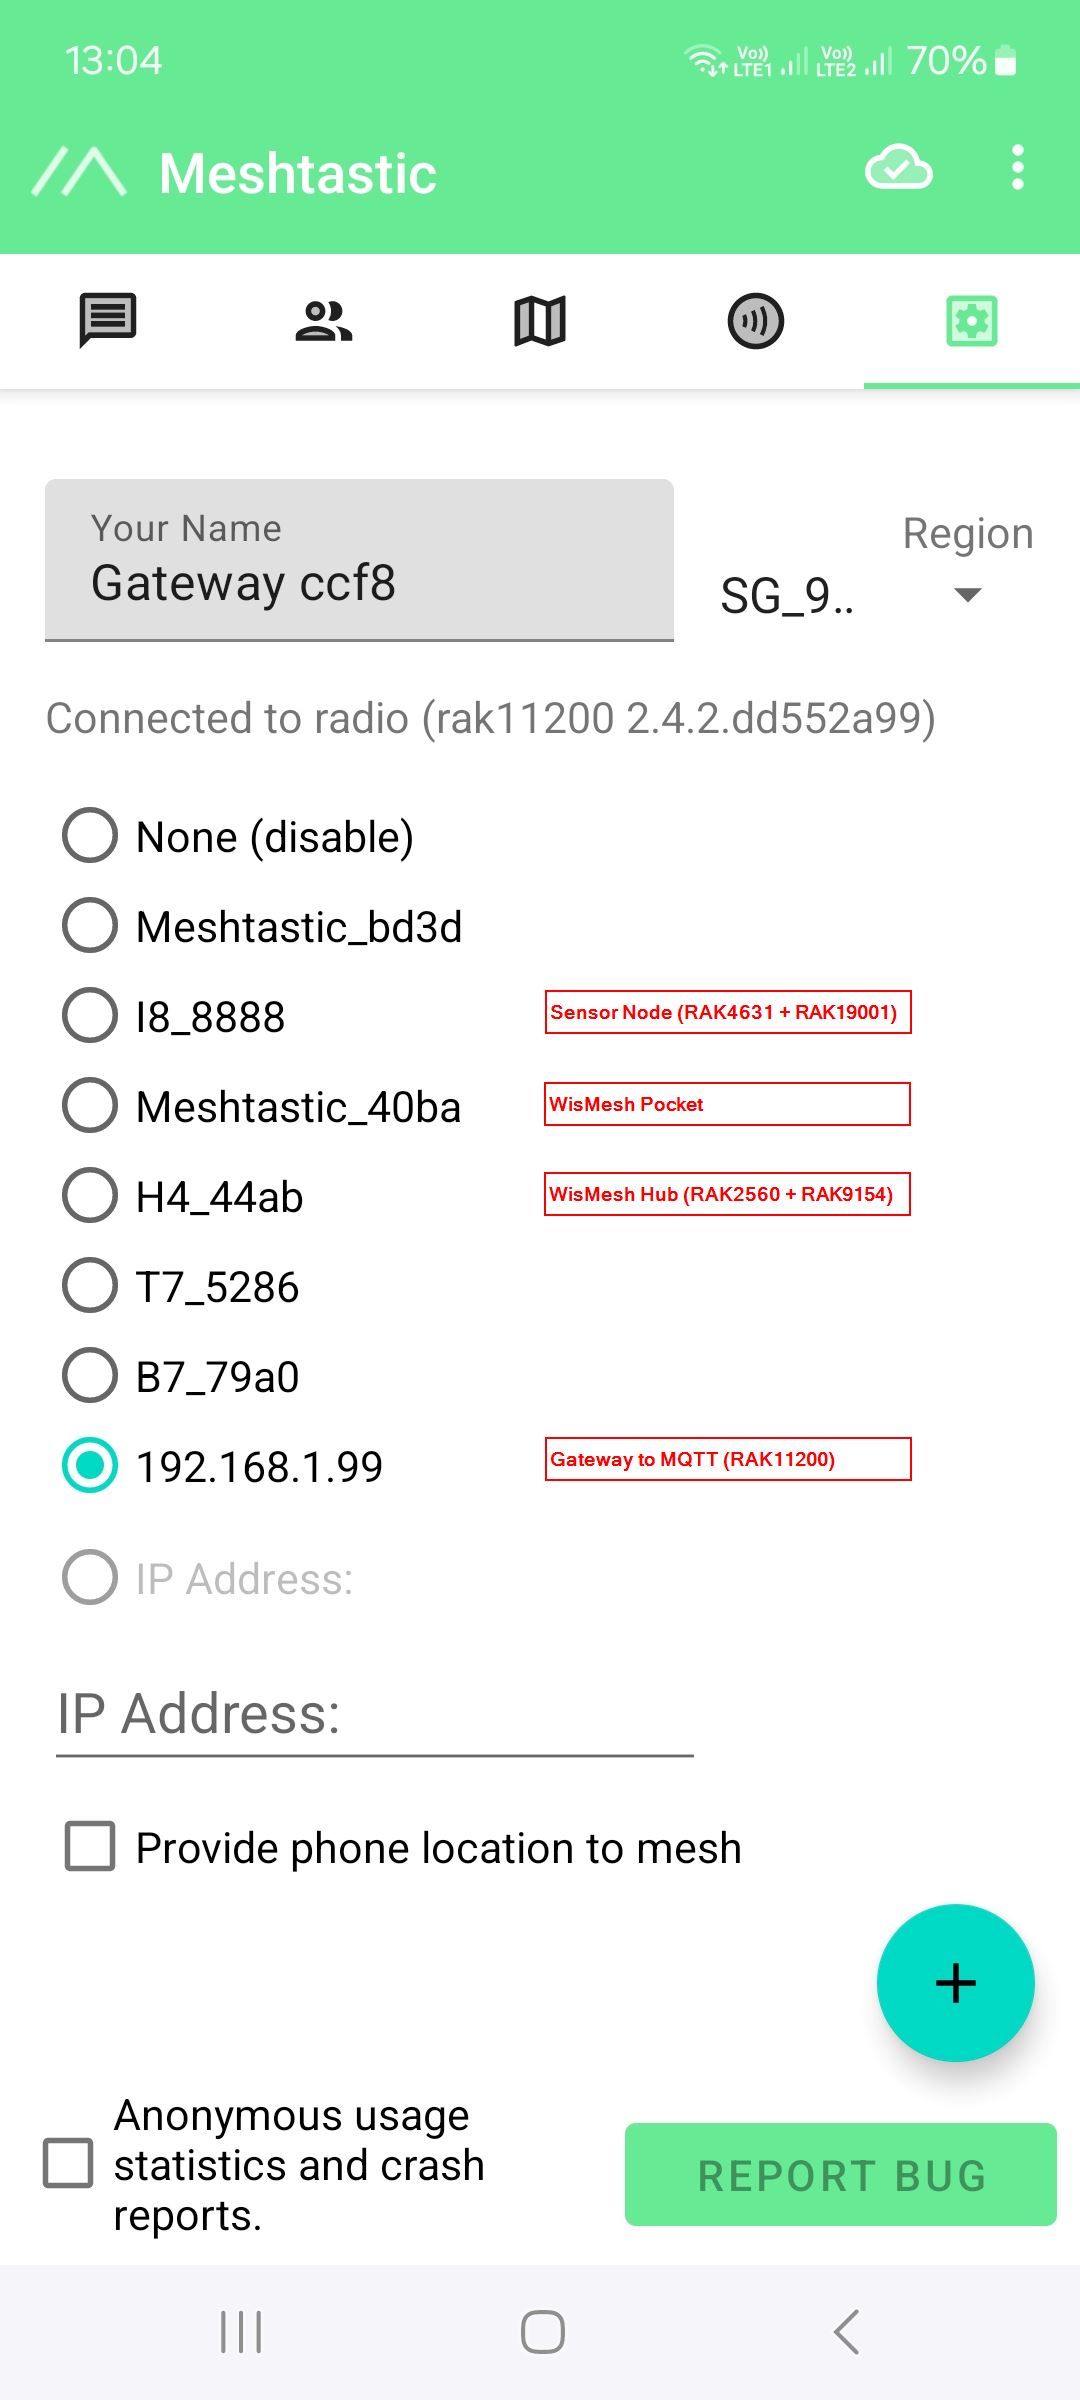
All devices have of course to be set to the same Region. My country is not listed (yet), the closest frequency selection (to avoid illegal usage of frequencies) is _SG_923_
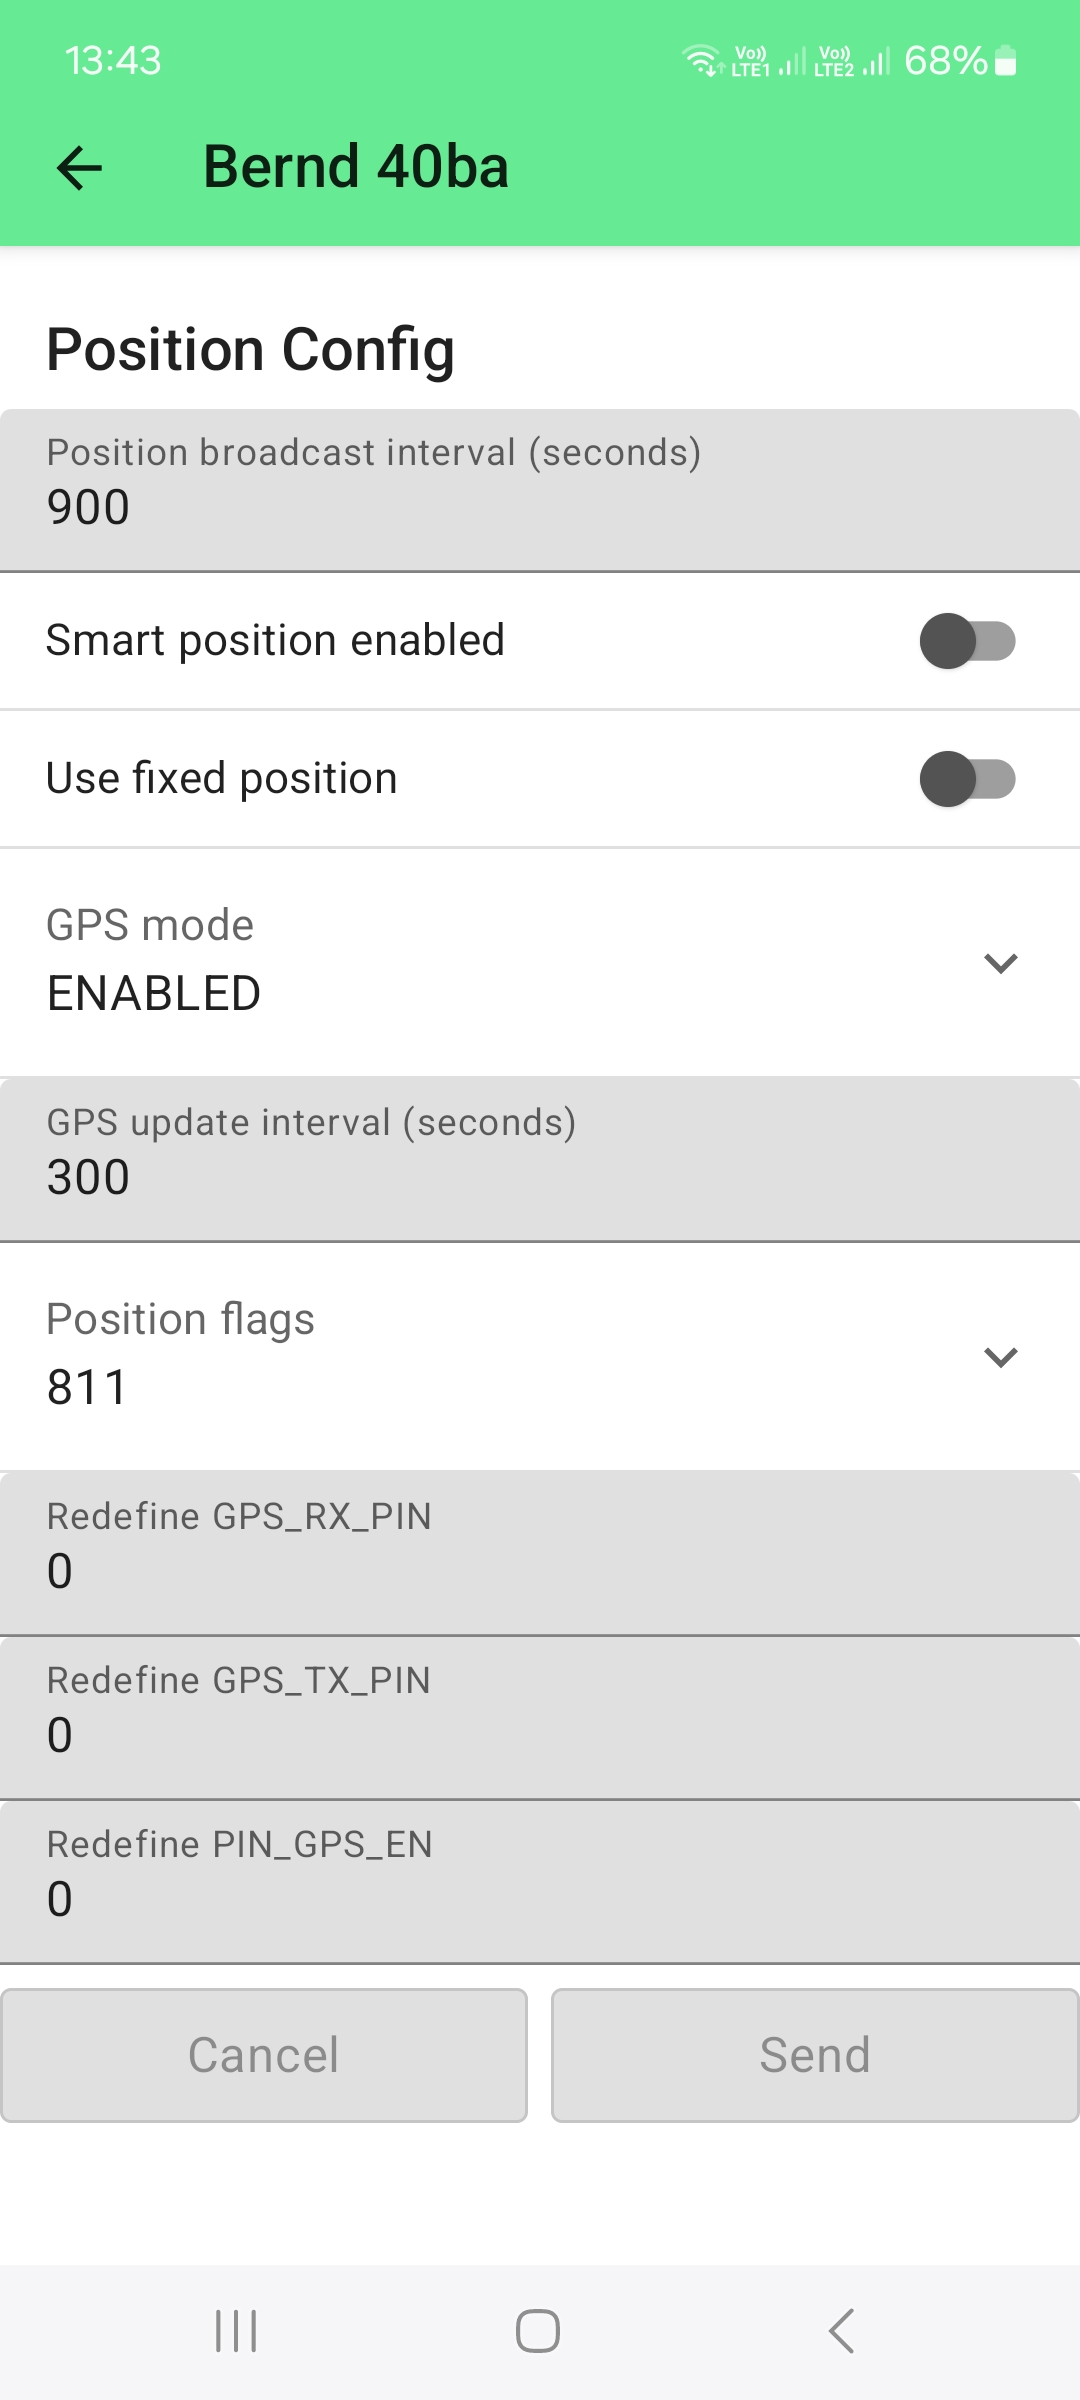
From the four devices used in the PoC, only the WisMesh Pocket has a GNSS location module.
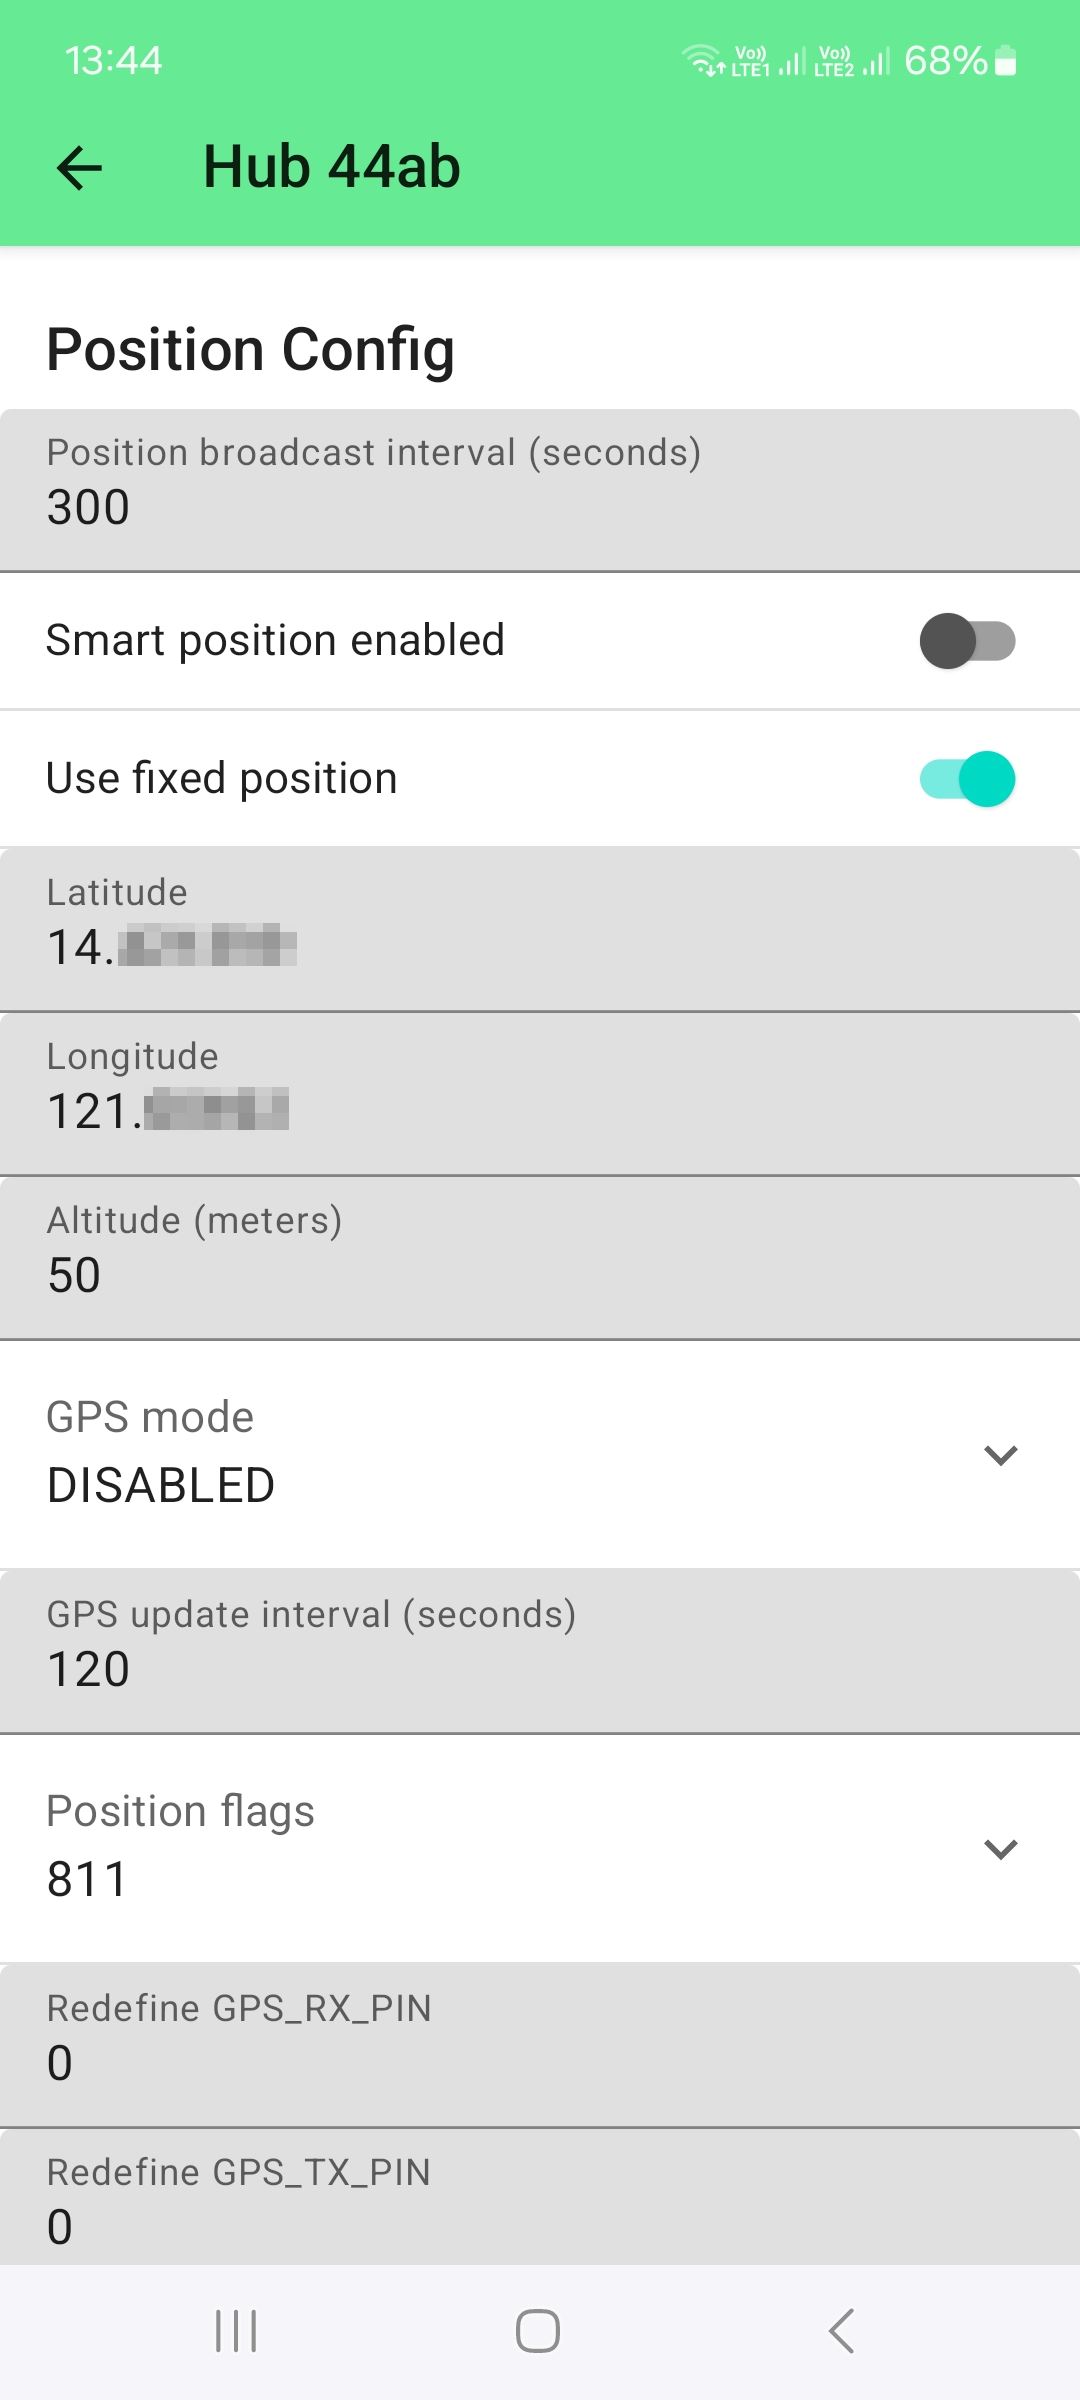
To still be able to see the device locations in the map, these devices are set to report a fixed location.
For this device, the location allocation is enabled in the settings to report the actual location of the device:
For these devices, the fixed location setting is enabled and the latitude and longitude is entered manually:
The gateway has to be connected to the internet. In this case, as we are using the RAK11200 with its built-in
WiFi.
Alternative the gateway could be setup with another WisBlock Core module (like the RAK4631 or RAK11310) and
the ethernet module RAK13800 to connect to a
wired network.
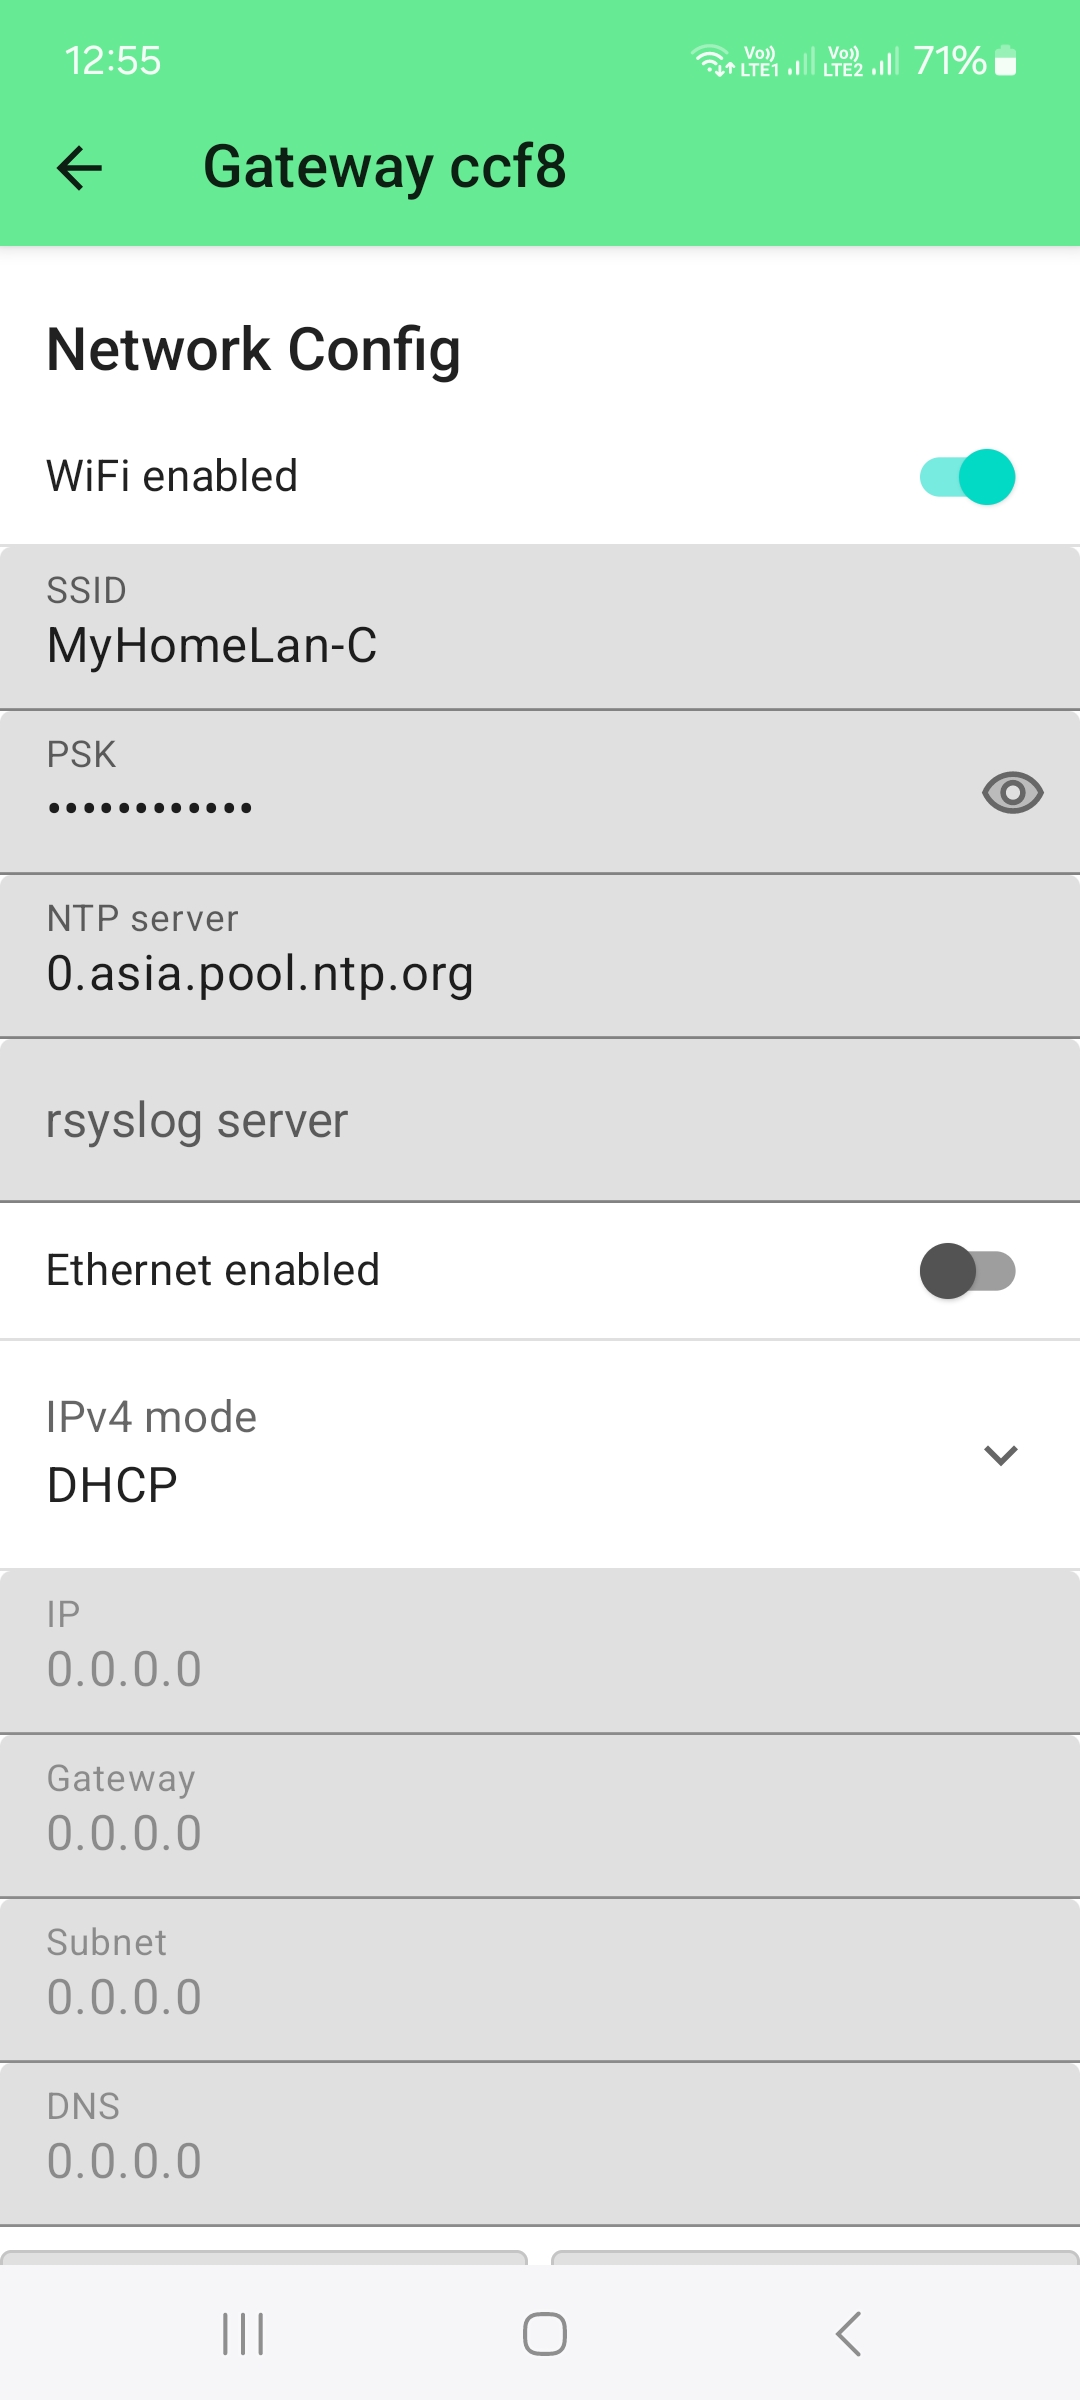
For this setup, we connect to the device first over BLE and setup the WiFi credentials.
Alternative the connection
settings can be done with the Meshtastic App or over USB and the Meshtastic Web GUI or command line utility.
Once
the device has connected to the WiFi network, it is shown with it's IP address in the device list.
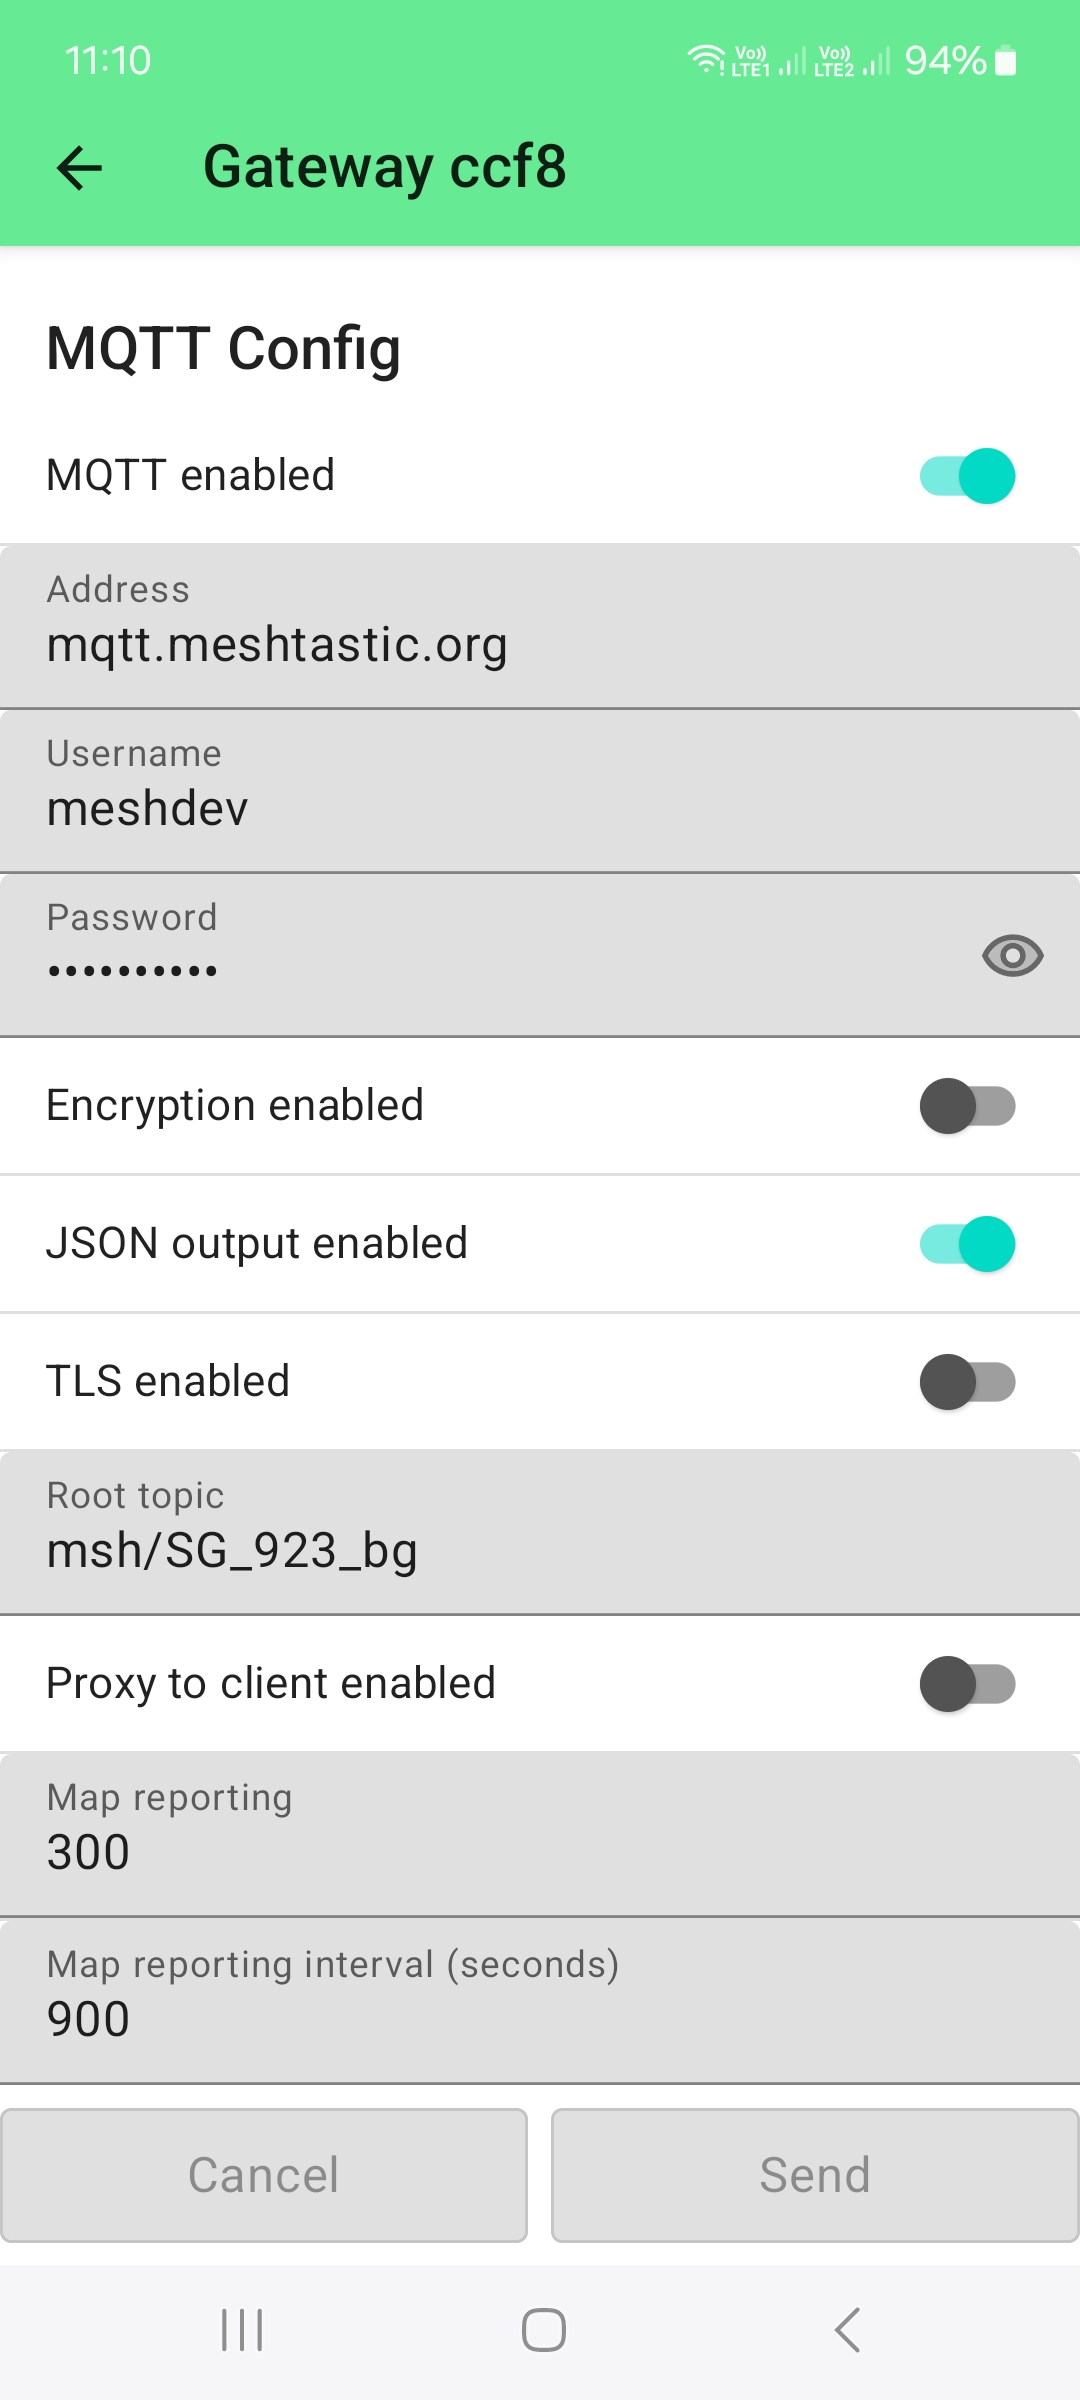
The next step is to setup the connection to the MQTT broker. Here we use the free MQTT broker provided by Meshtastic:
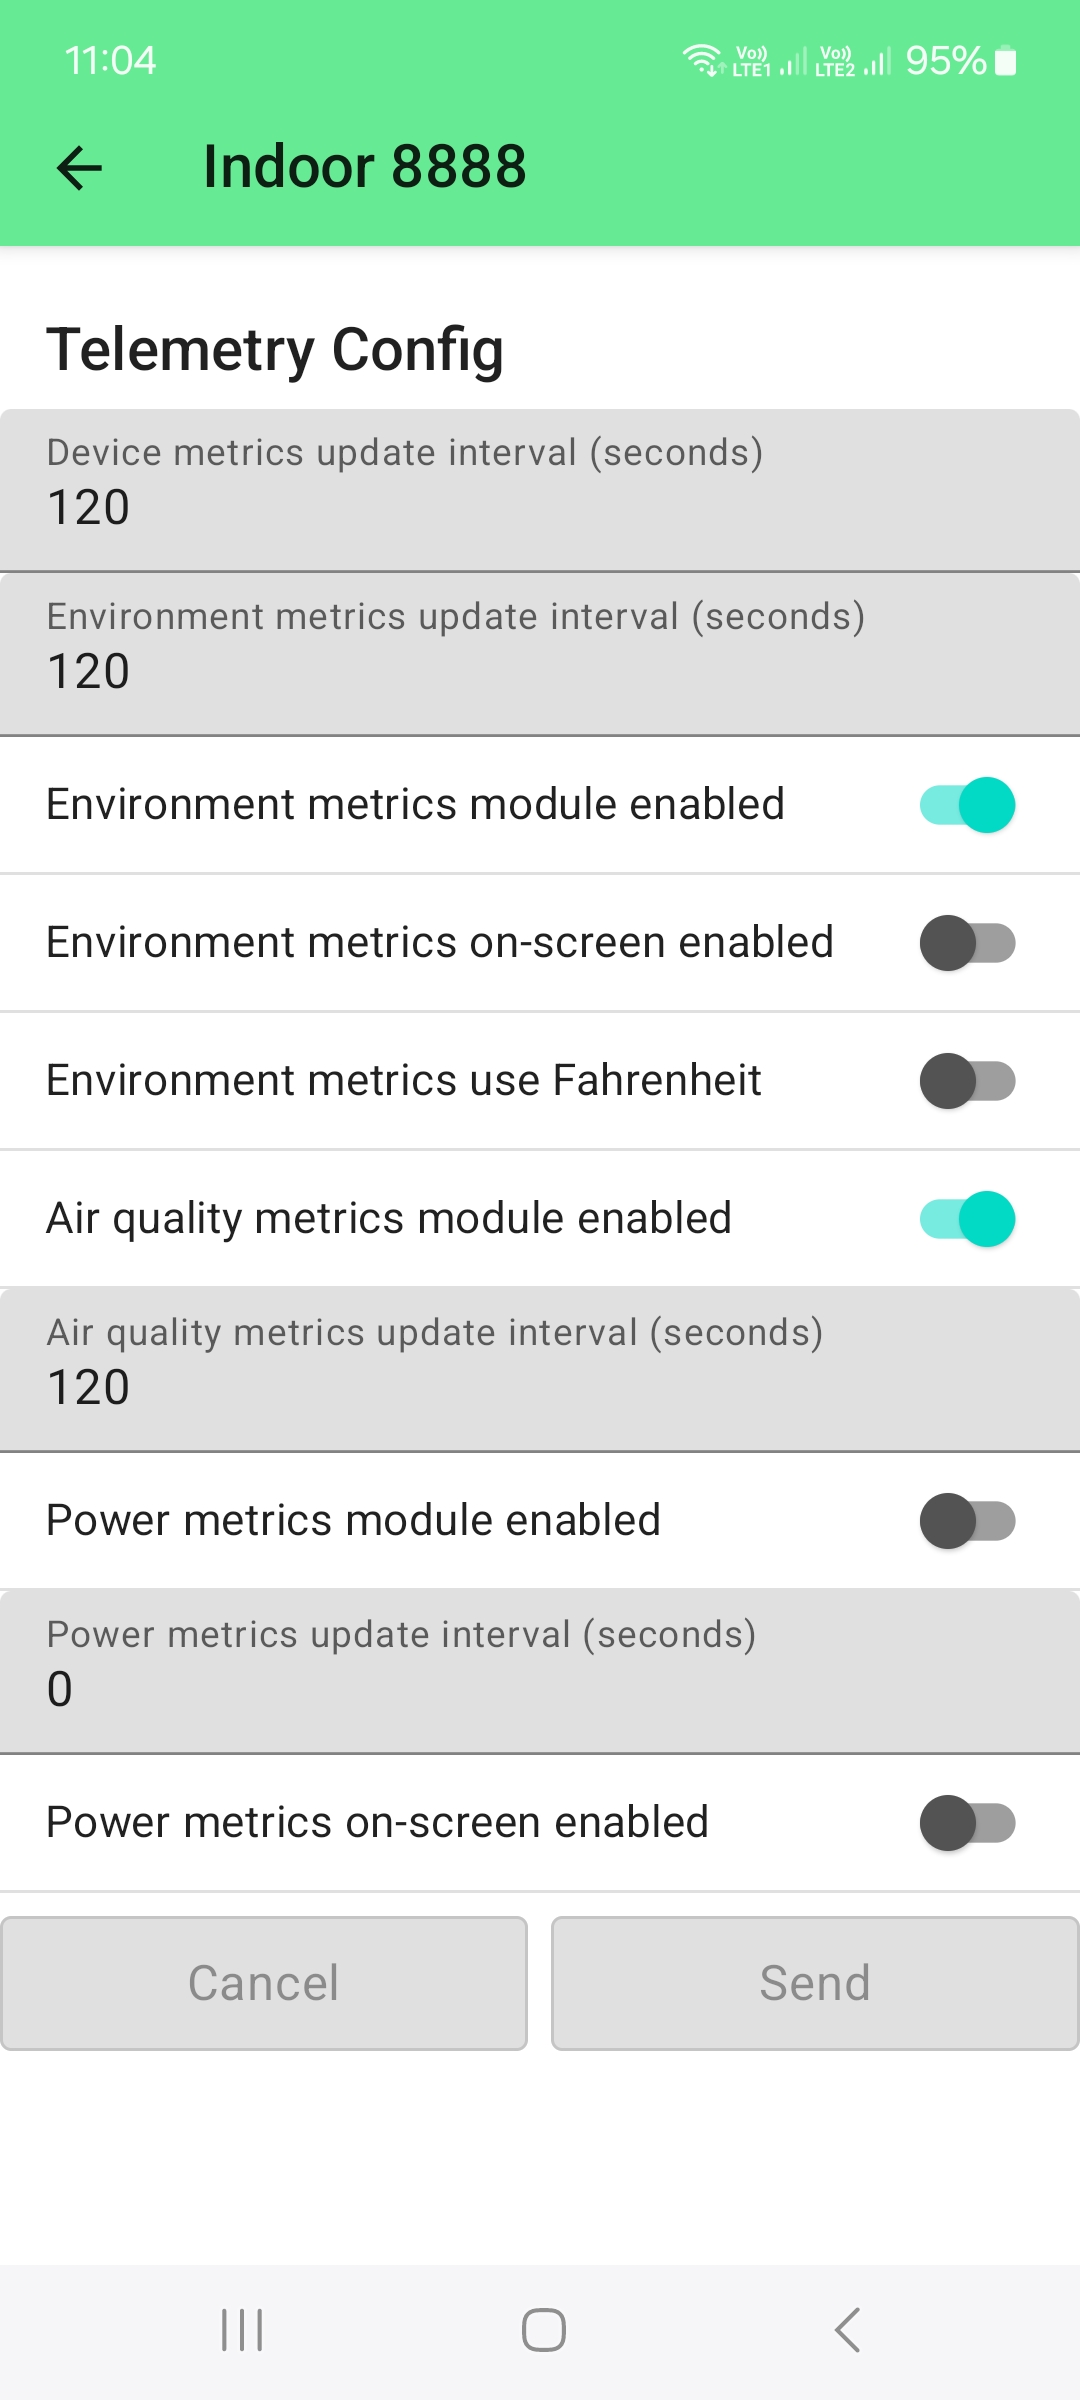
As this node is only communicating over LoRa, the required setup is focused on the Telemetry Config:
Meshtastic is sending the environment sensor data and the particle matter sensor data through two different metrics, the Environement metrics and the Air quality metrics. So both of them have to be enabled.
This device is designed as a repeater or hub to extend the coverage of the Meshtastic network. Usually this device
would not have any sensors, it will report only its battery status.
For this PoC, the WisMesh Hub was equipped
with a temperature and humidity sensor RAK1901.
To see these sensor values, the setup is similar to the sensor node, only in the Telemetric Config only the Environment metrics is enabled. The Air quality metrics is not required.
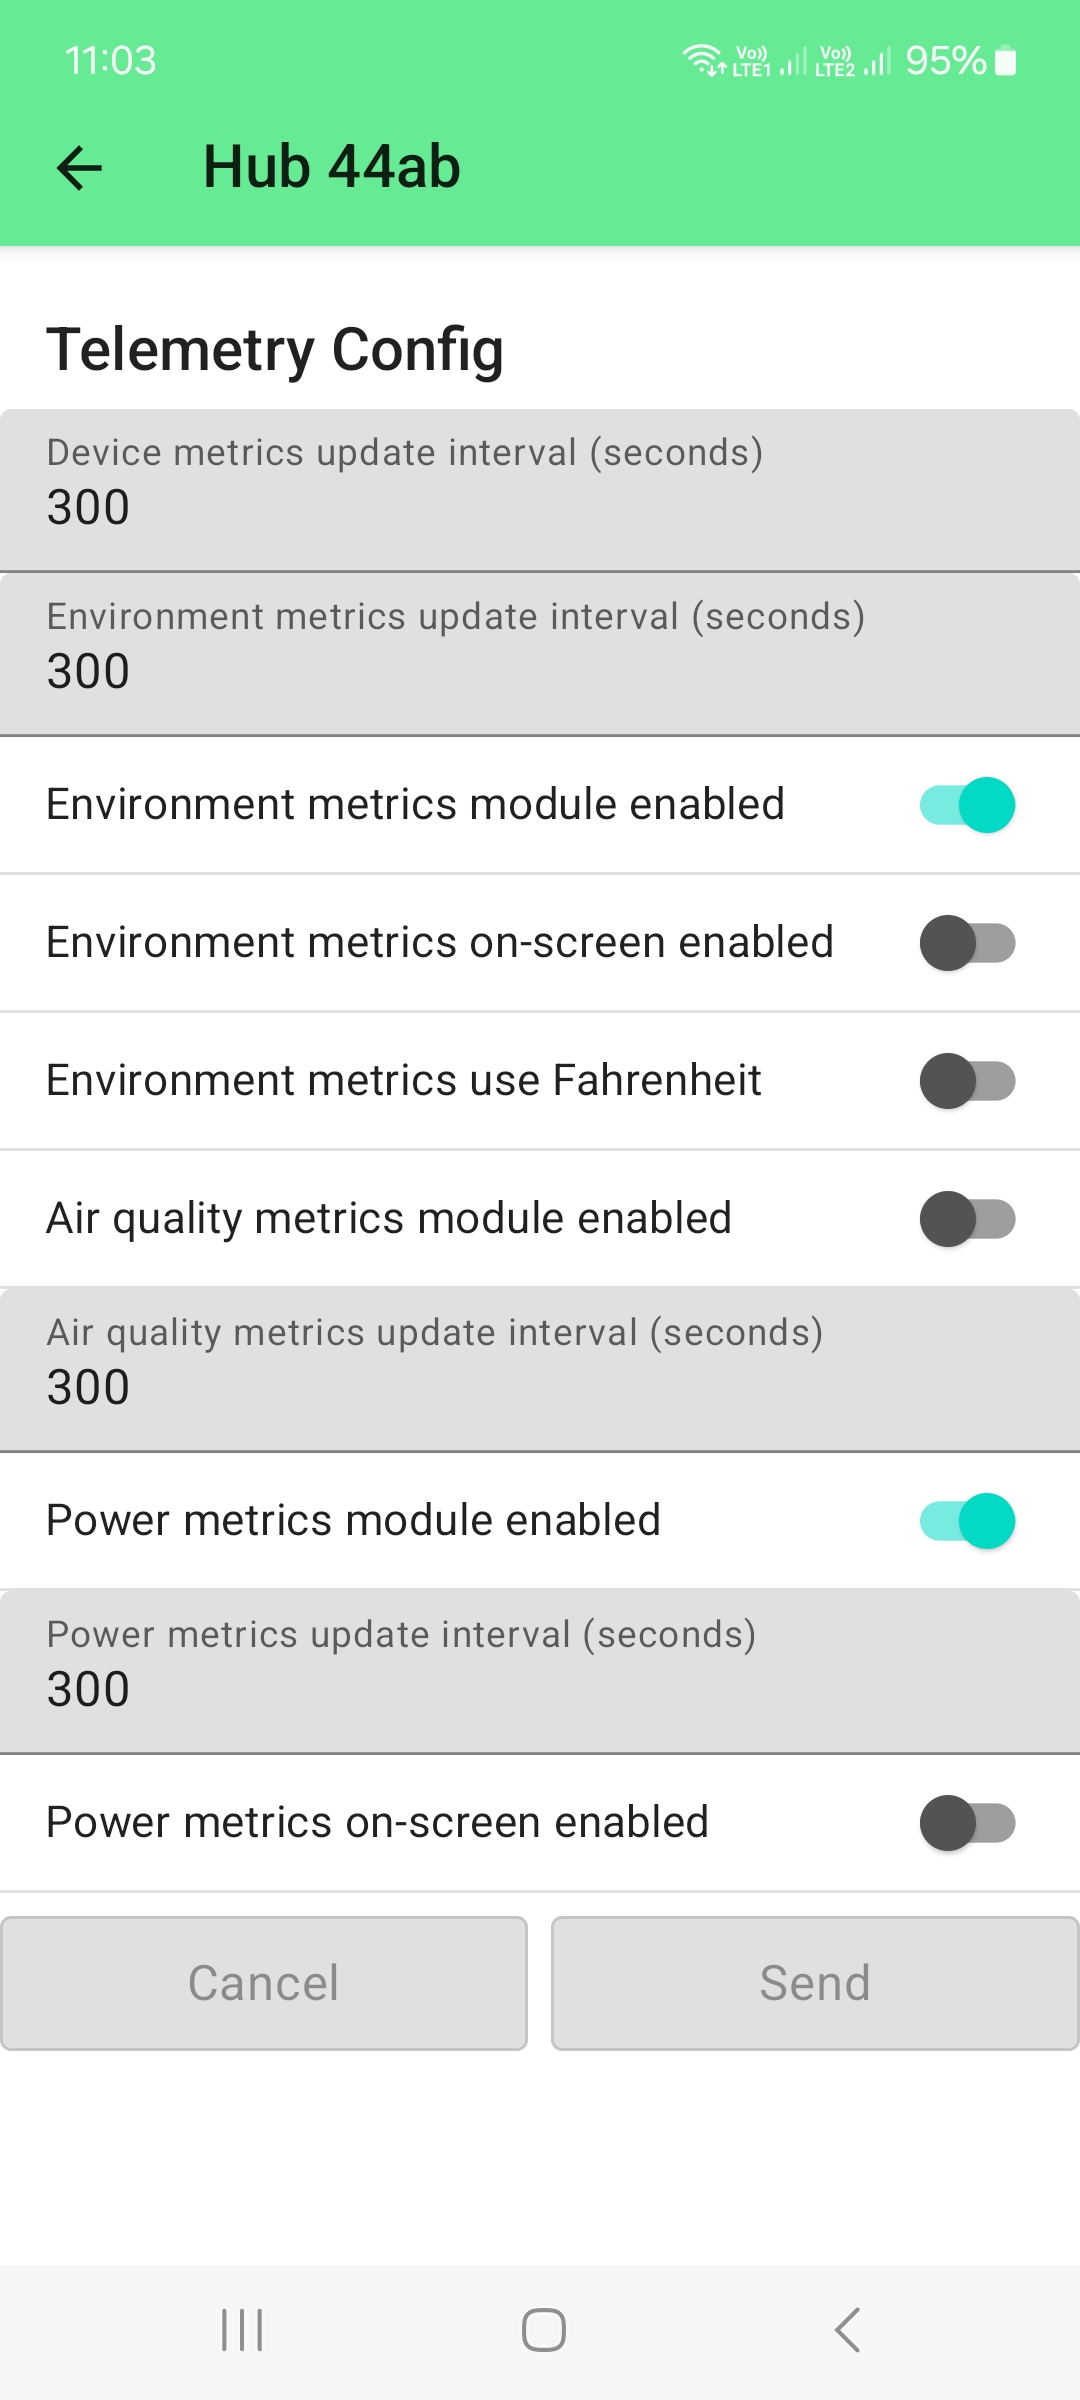
The Power metrics are shown enabled, but it is not necessary to do so. The WisMesh Hub will report it's battery status through the Environment metrics
As this device does not have any sensors, only its GNSS location module, no further setup is required.
All devices are based on WisBlock. The WisMesh Hub (coming soon) and the WisMesh Pocket are ready to use devices that can be bought directly from the RAKwireless Store.
The sensor node is built with
The gateway node is built with
Once the hardware is setup and running, the data of the devices can be seen in the Meshtastic MQTT Broker.
I used
the MQTT-Explorer to connect to the broker.

To limit the number of data shown, I subscribe only to my topic _msh/SG_923_bg_.
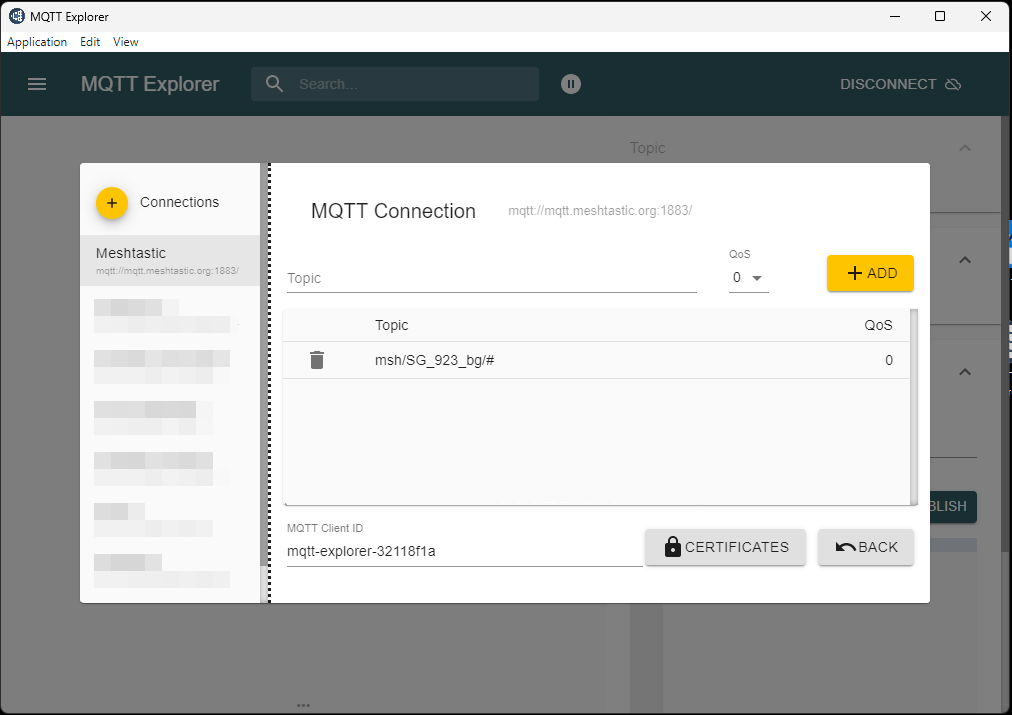
After connecting, I can see the messages coming in from the Meshtastic gateway.
To process the data and visualize it, NodeRED, InfluxDB and Grafana are used.
This readme does not cover the
installation and setup of these applications. It is assumed that they are already up and running.
Of course any other combination of applications can be used, e.g. Python scripts.
With only four nodes the Meshtastic node data is received, parsed and forwarded to the database:
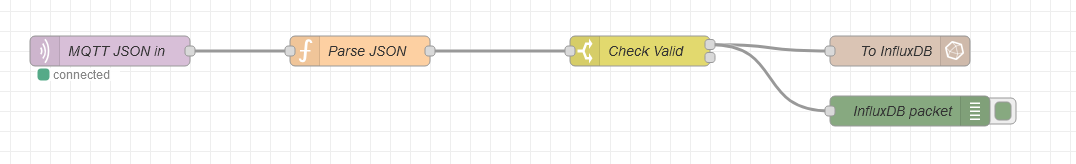
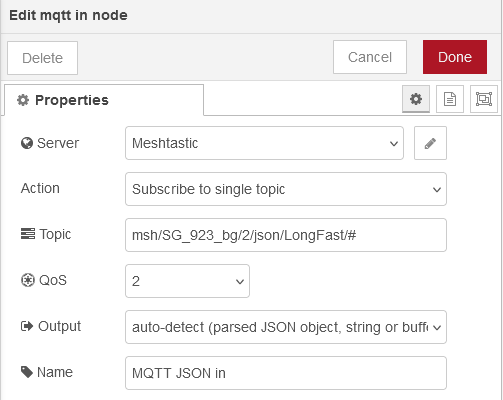
This node is connecting to the MQTT Broker and subscribing to topics.
It is a "standard" node
available
in NodeRED.
The setup is in two steps:
First the connection to the MQTT broker has to be setup. Place the node in the flow, then double click to open
its
settings.
In the first settings screen, click on the edit icon and create a new connection:
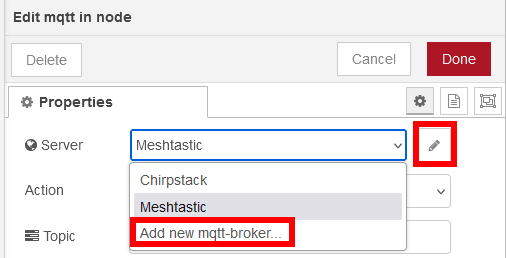
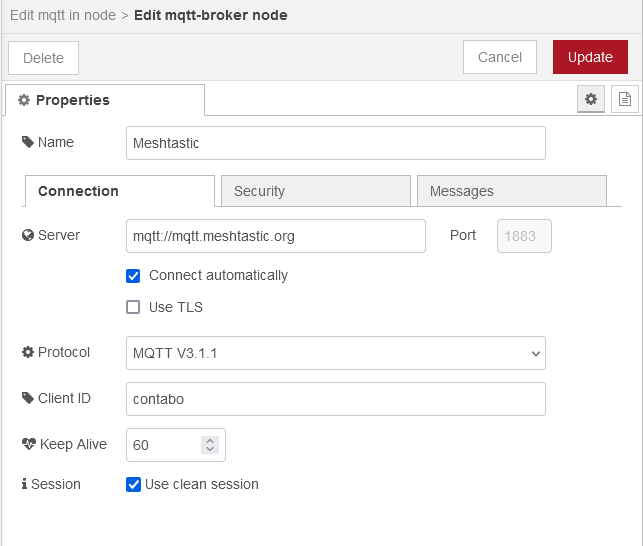
In the next window, add the MQTT broker information, this has to be the same Broker that is used in the Meshtastic gateway. Set the URL in the Connection tab, the username and password in the Security tab and the connection/disconnection messages in the Messages tab.
After updating the connection settings, enter the topic we are interested in and subscribe to a single topic. Select auto-detect as Output.
This node is a function node that is parsing the incoming data to
The code for this node can be found in mqtt-in.js.
The part that needs to be edited
for
different devices is the first check, which node the data is coming from:
// Check where the data is coming from
if (msg.payload.from == 1129595066) {
    node_id = 'pocket';
} else if (msg.payload.from == 436487339) {
    node_id = 'hub';
} else if (msg.payload.from == 647006344) {
    node_id = 'ind';
} else if (msg.payload.from == 2471283960) {
    node_id = 'gw';
} else {
    node_id = msg.payload.from.toString();
}
This turned out to be a little bit difficult, because the JSON payload did not include the device names. Instead it has the node ID, but it is shown as decimal value. The node ID is not shown in the Meshtastic mobile app, only the node name. So it took some detective work to find out which data is coming from which node and place the node ID into the Java script code.
The node_id set in this code part is later used in Grafana to get the data from the different nodes for visualization.
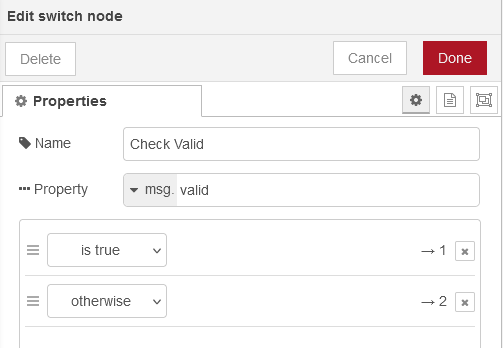
This is a simple switch node. If the incoming data is of interest (valid), it will forward them to InfluxDB. Otherwise the data is discarded.
The complete NodeRED flow with all nodes can be found in node-red-flow.js
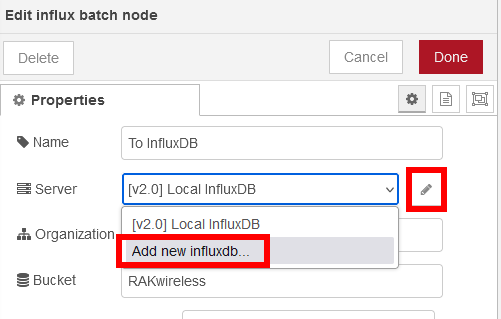
This node has to be installed separate. It is from the node-red-contrib-influxdb palette. You need
to
install it in NodeRED through Manage Palette.
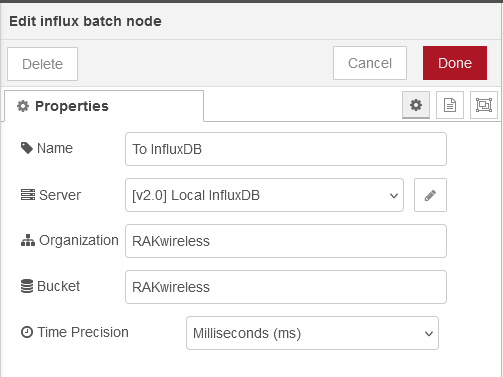
Here the `influxbatch node is used to send multiple data together with a timestamp to the database.
Similar to the MQTT broker setup, first the connection to the InfluxDB database has to be setup. After placing the node in the flow, double click it to open the settings. Choose the edit icon to add a new database connection:
Then enter the connection information for the InfluxDB database
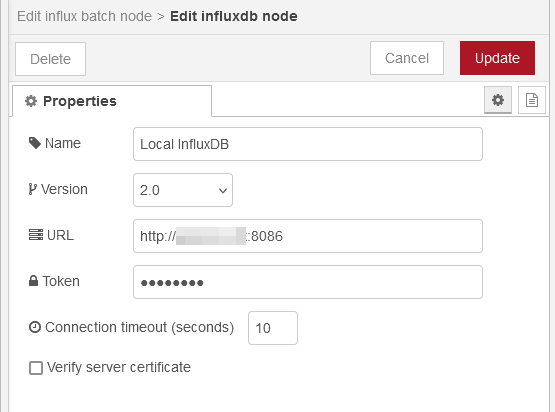
Token fieldOnce the connection is saved, enter the Organization and the Bucket name. You need to
create these in InfluxDB V2 as well.
If everything is setup correct and the flow is deployed, the parsed data is shown in the debug output created by
InfluxDB packet
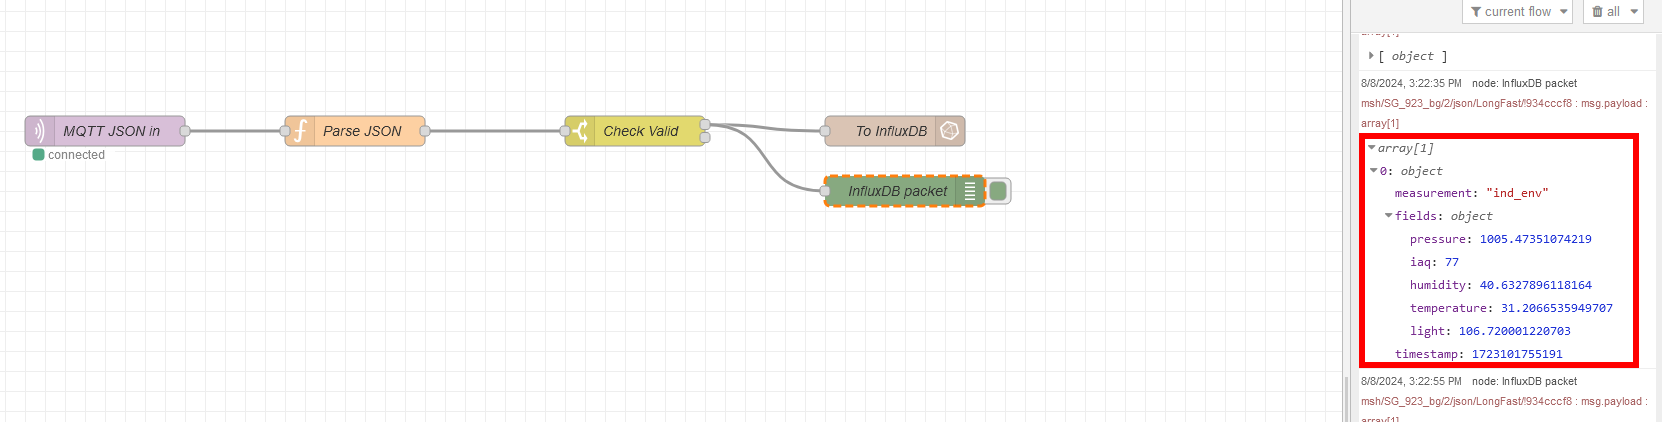
In influxDB you can use the Data Explorer to see the incoming data
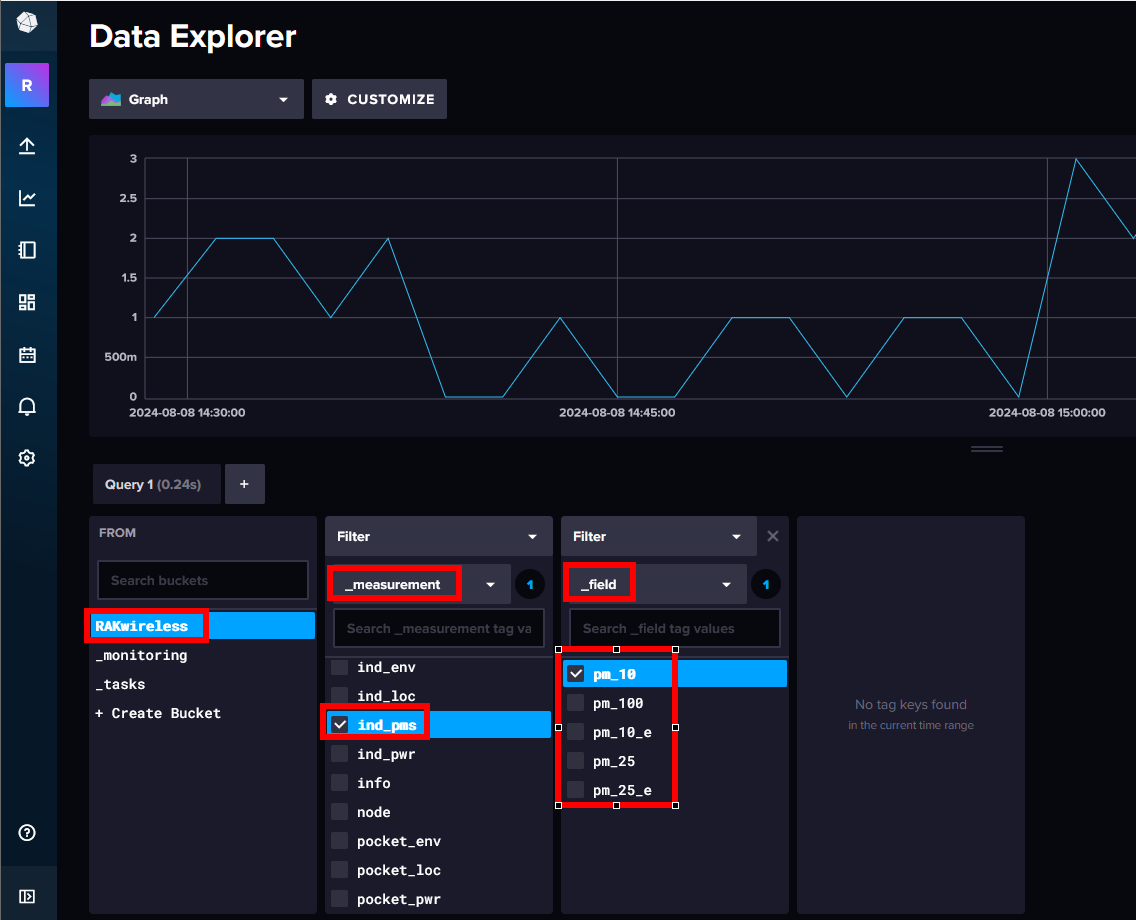
You can see in the first filter in the _measurement, the node names we assigned before in the
NodeRED
flow.
The second filter shows the sensor data.
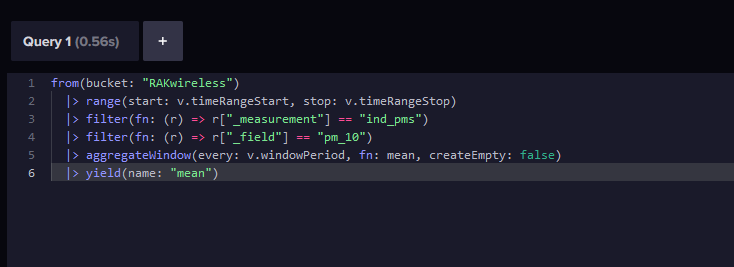
The Data Explorer can be used as well to create the data query in the form we need later in Grafana to pull the
data
from the database. Click on the Script Editor button

It will show now the query we need for Grafana
This tutorial is not covering the installation of Grafana and how to setup a connection to the influxDB database. It is assumed that this is already done.
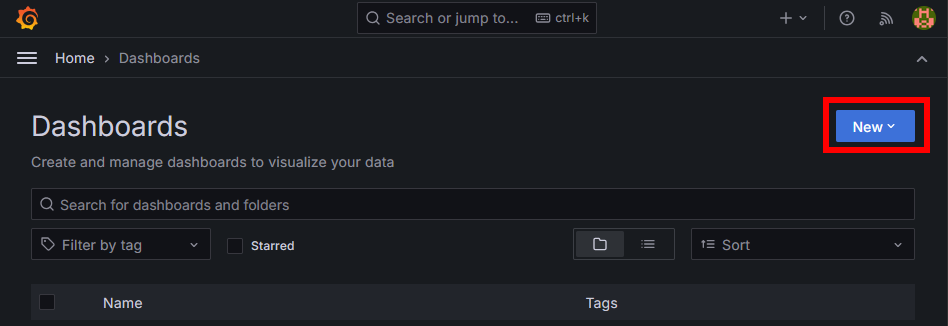
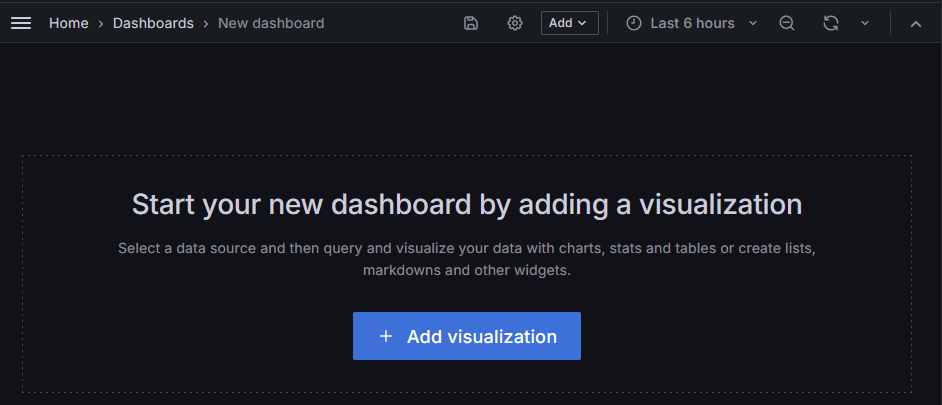
In Grafana, create a new Dashboard and add a visualization.
Once the new dashboard is open, add a visualization.
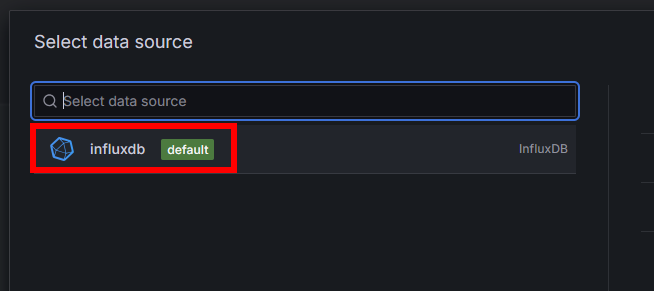
Add the data source
Then copy the query created in influxDB into the query field and push the refresh button to see the data
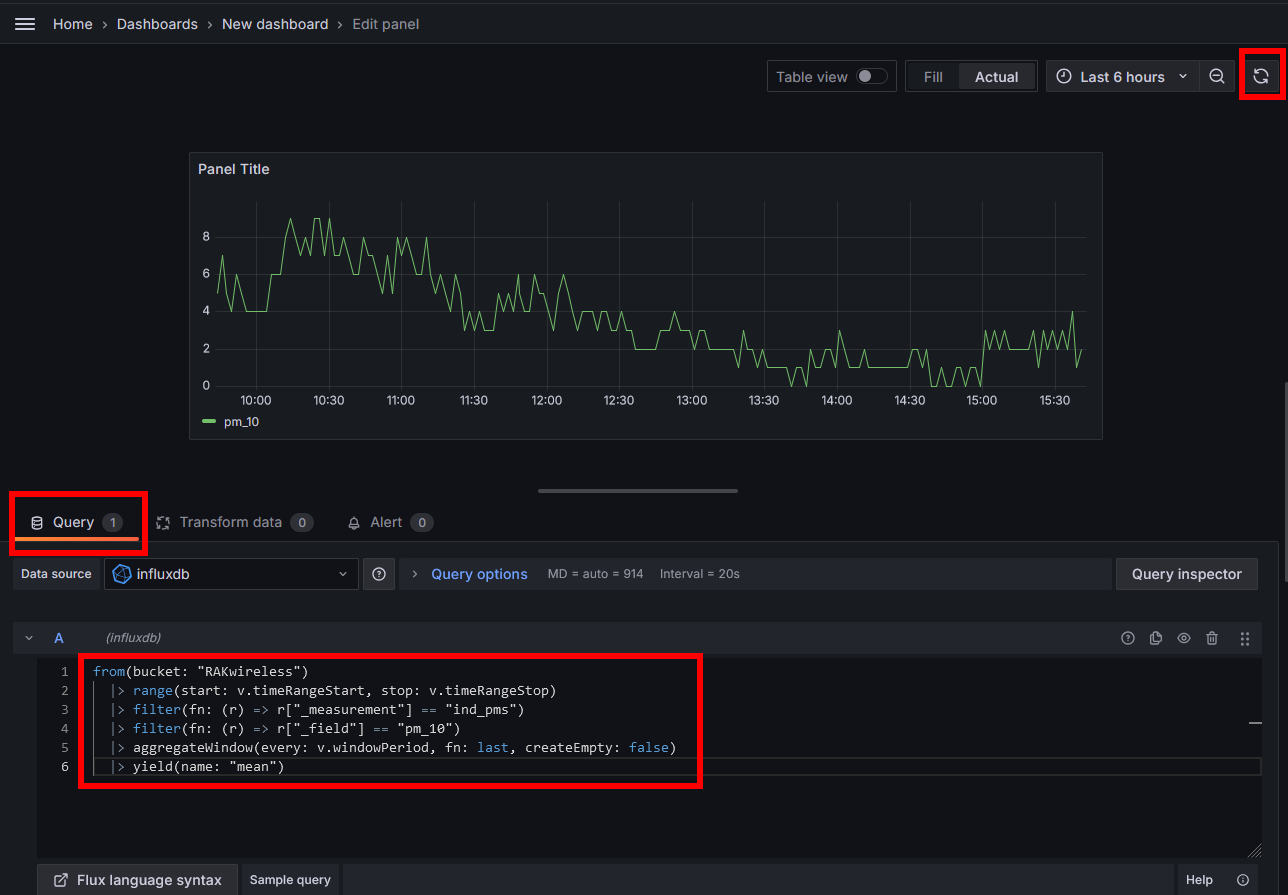
This has to be repeated for each single data you want to show in the dashboard.
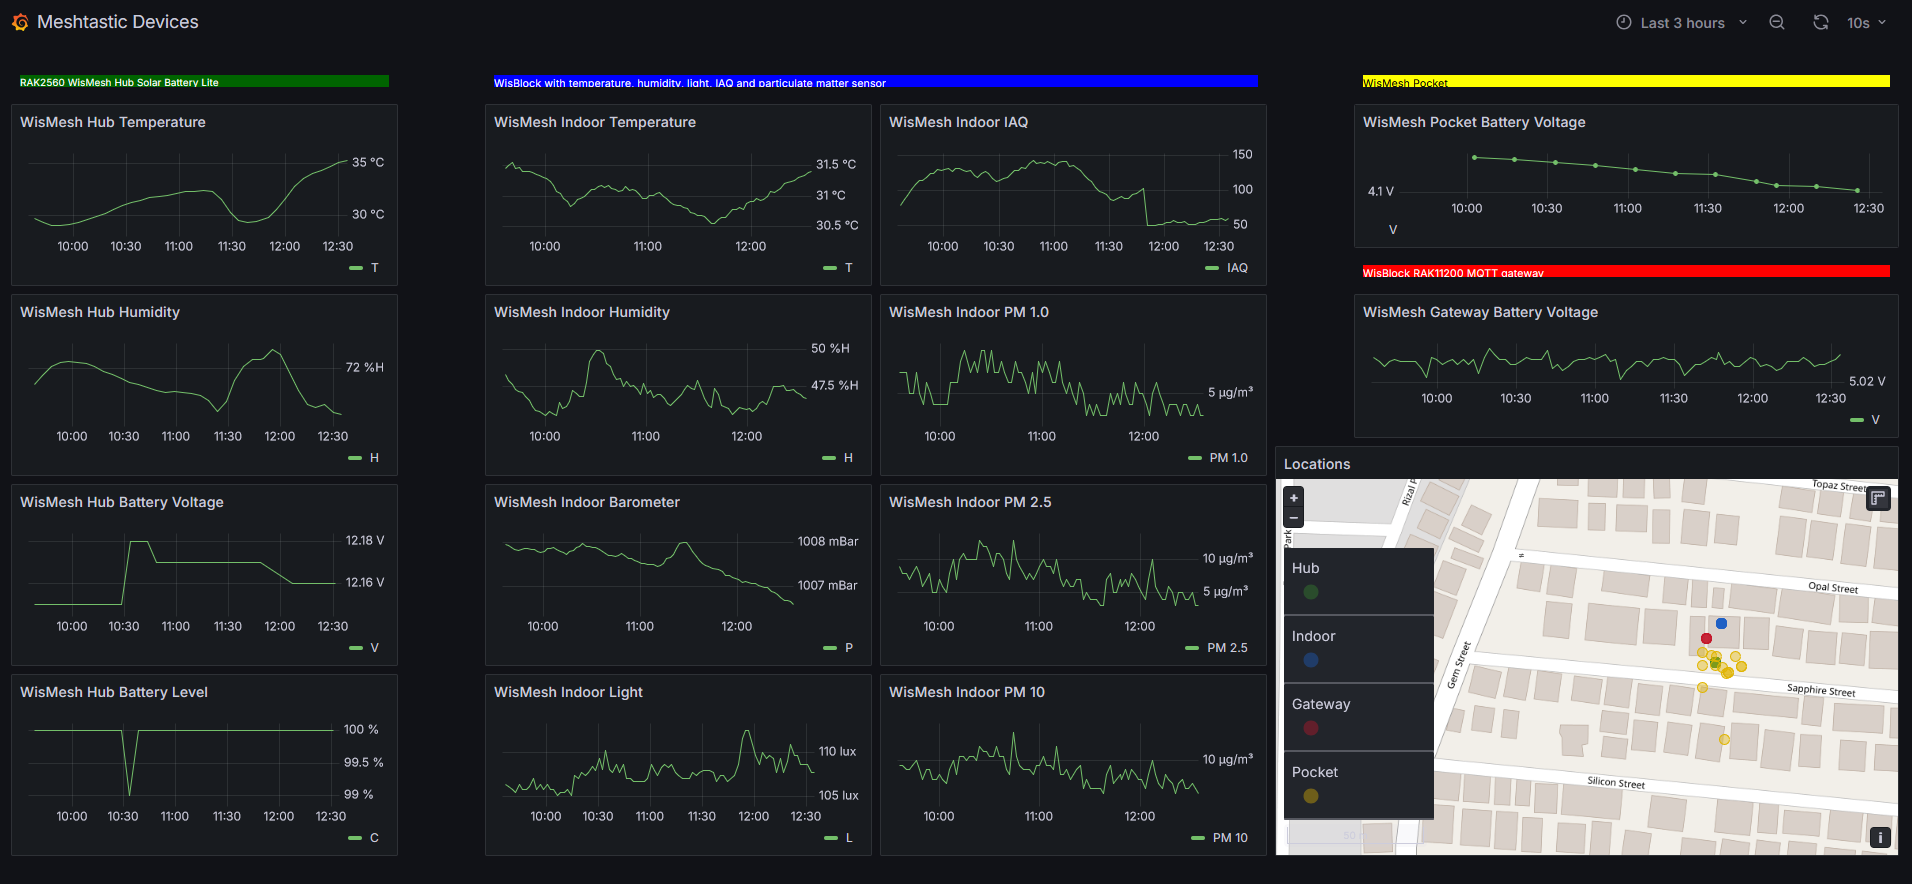
The result could look like my dashboard (or different, depending on your sensors and your personal preferences)
A (for some time available) live link to my setup can be seen on Meshtastic
Devices
Alternative link (above seems not working always) Meshtastic
Devices